10 Decisions Behind Every Self-Directed Portfolio.
Ten decisions, in the order they matter, each one written so you can act on it this evening. Built for UK and US self-directed investors who already run their own portfolio, or are about to start.
Published 3 June 2026Read time approx. 30 minutesFormat open, no email gate
Most "how to invest" content is either too thin (a 600-word listicle telling you to "diversify and stay the course") or too deep (a 400-page textbook on portfolio theory). Neither helps the person who has already decided they want to run their own portfolio and now needs a structured set of decisions to work through, in the right order, with the maths laid bare.
This guide is that middle layer. Ten decisions, in the order they matter, each one written so the reader can act on it the same evening they read it.
Who this is for
UK or US investors with a portfolio of any size from £10,000 upward who manage it themselves (or are about to start), on any platform. The maths is the maths regardless of whether you have £20,000 in an ISA or £750,000 in a SIPP. Where the answer differs by jurisdiction, both are covered side by side.
How to use it
Work through the principles in order. Each one is independent enough to revisit later. If you are short on time, read the "the decision" and "what to do this week" blocks for each principle; that alone gives you the full action list in about ten minutes. The full read takes thirty.
Every figure cited is sourced inline. Every fund and platform named uses real 2026 tickers and fee schedules. Where a figure may move between publication and your reading, the source link to the live schedule is shown.
This guide was written by the team at Allocra, who build independent tools for self-directed investors. Allocra is mentioned twice in the body of this guide (here and at the close) plus optional sidebars on three principles where the tool fit is genuine. Nowhere else.
This guide is educational, not advice. If your situation is complex (large portfolio, recent inheritance, expat tax status, business structure) or you are unsure whether a particular approach is right for you, work with a fee-only independent financial adviser charged hourly. The full disclosure sits at the end of the guide.
Principle 1 of 10
Choose your broker first, then the ETF
The decision
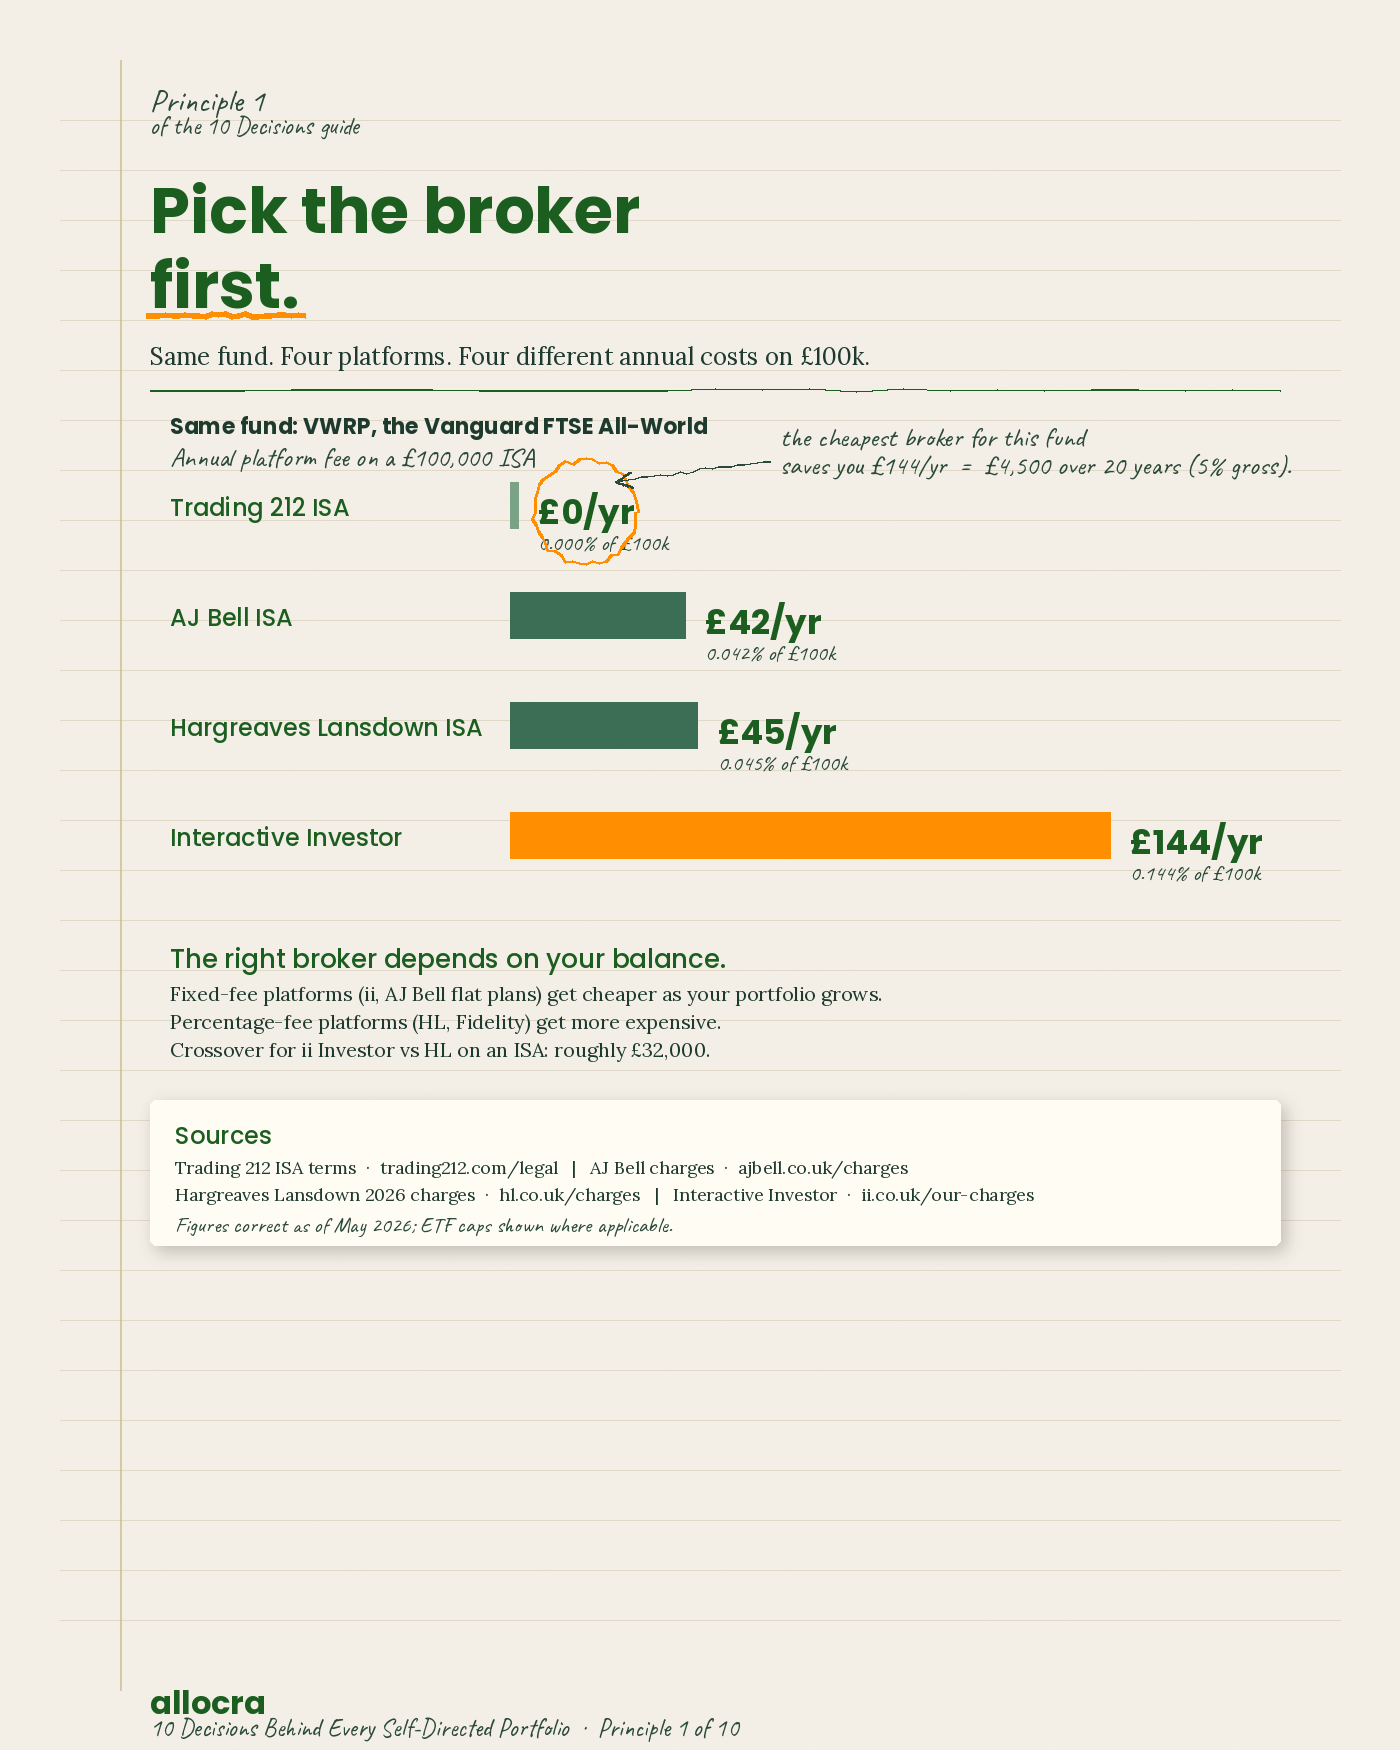
Pick your broker before you pick a fund. The platform you hold an ETF on determines whether that ETF costs you 0.10% per year or 0.55% per year, regardless of what its factsheet says.
Why it comes first
Every cost analysis you do downstream depends on this decision. A Vanguard FTSE All-World ETF has a 0.22% TER whether you hold it on Hargreaves Lansdown or Trading 212. The difference between holding it for 0.22% and holding it for 0.67% is entirely the platform fee, and that fee compounds against you every year you own the fund. If you choose the fund first and then look for a platform, you have already lost the negotiation.
The maths
Take a £100,000 portfolio held in a stocks and shares ISA. On Hargreaves Lansdown, the ISA platform fee for funds is 0.45% per year (capped, with caveats; the 2026 schedule is at hl.co.uk/charges). On Interactive Investor, the Investor plan is a flat £11.99 per month, which on £100,000 works out at 0.144%. On Trading 212, the ISA platform fee is 0%. Same fund. Same ETF. The annual cost differs by 0.45 percentage points purely because of the platform.
Over twenty years, on a 5% real return, that 0.45% drag costs roughly £35,000 of terminal wealth on a £100,000 starting balance (lump sum, no further contributions). The fund itself is identical. The choice that drives the £35,000 is the broker.
Where it flips
Fixed-fee platforms (Interactive Investor, AJ Bell with its capped ETF charge) get cheaper as your balance grows. Percentage-fee platforms (Hargreaves Lansdown, Fidelity) get more expensive as your balance grows but are competitive at small balances. The cross-over for ii's Investor plan against HL's 0.45% ISA fee sits at roughly £32,000; below that, HL is cheaper, above that, ii is cheaper. Run the maths against your own balance and your own platform's current fee schedule.
For US readers: the same logic applies but the platforms are different. Fidelity, Schwab, and Vanguard all charge zero platform fees for self-directed brokerage accounts in 2026, which makes broker choice less about cost and more about tooling, fractional share support, and tax-lot reporting. The decision still comes first; the answer is just easier.
What to do this week
Write down your current platform's percentage cost for your account type (ISA, SIPP, GIA, Roth, 401(k), brokerage).
Take your portfolio's total value and multiply by that percentage. That is your platform fee for the year.
Compare against the two largest competing platforms in your bracket using their published 2026 fee schedules.
If switching saves more than 0.10% per year, start the transfer (in-specie if your platform supports it; in-specie keeps you in market while the transfer completes).
Sources
Hargreaves Lansdown 2026 fee schedule: hl.co.uk/investment-services/charges. Interactive Investor service plans: ii.co.uk/our-charges. Trading 212 ISA terms: trading212.com/legal. AJ Bell charges: ajbell.co.uk/charges.
Figures correct as of May 2026; check the live schedule before acting.
Principle 2 of 10
Run total cost (P+O+T+F+X+D minus S), not just TER
The decision
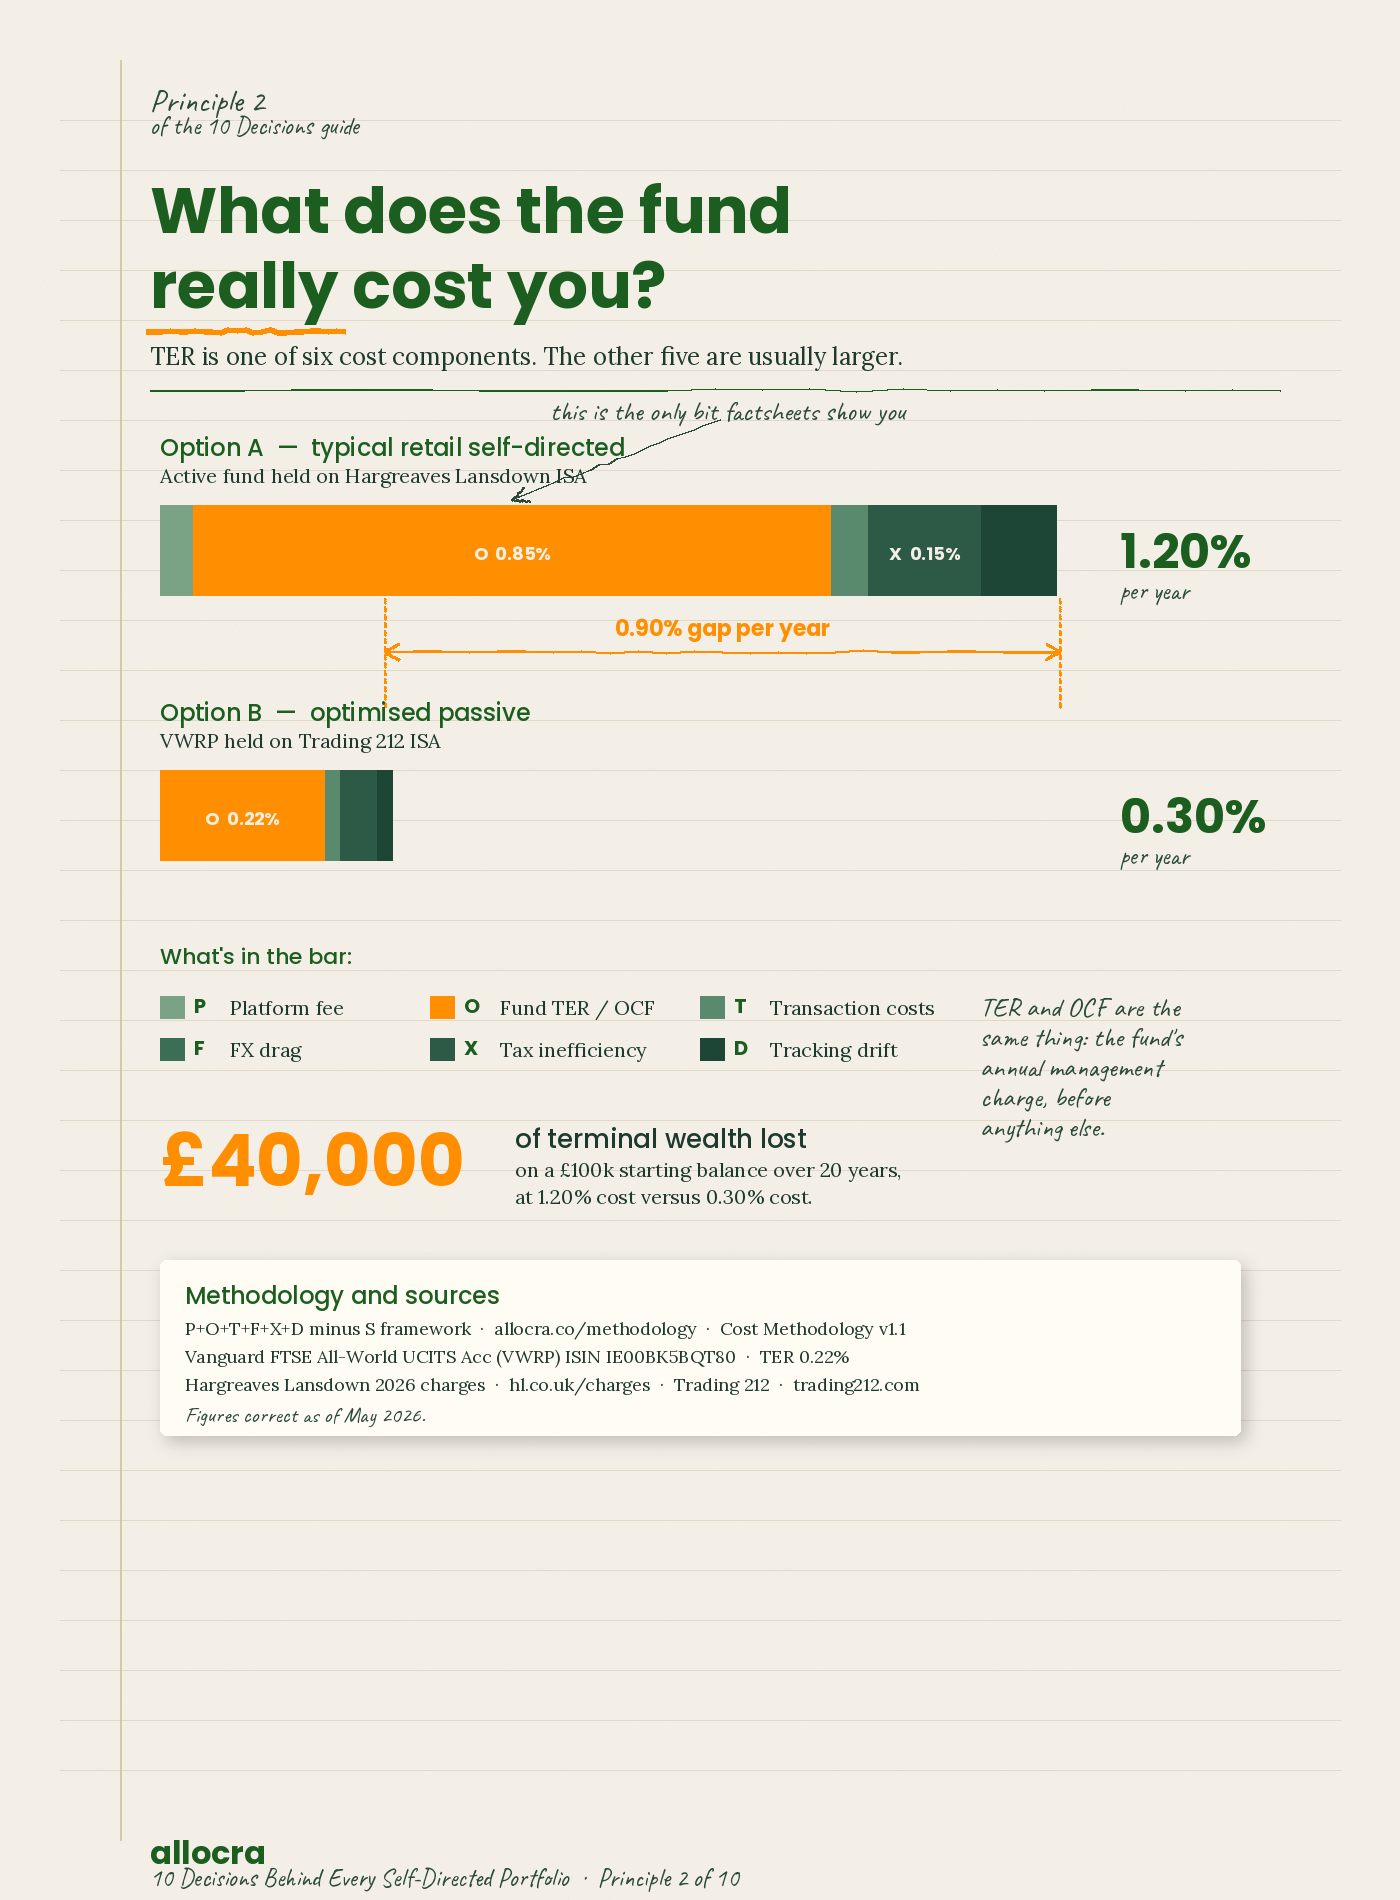
When you compare two funds, do not stop at the TER on the factsheet. Add platform fee, transaction costs, FX drag, tax inefficiency, and tracking drift, then subtract any securities-lending rebate. That sum is the real cost of holding the fund. The TER on its own is usually a small fraction of it.
Why this matters
TER (Total Expense Ratio, sometimes called OCF on UCITS documents) measures only the fund's internal annual charge. It does not include the cost of holding the fund on your platform, the cost of trading it, the FX you lose when buying a US-listed fund in sterling, the tax that leaks through dividend withholding, or the drag from how well or badly the fund tracks its index. Those are five separate cost components, and they often dwarf the TER.
The six components in shorthand:
P (Platform): what your broker charges you to hold the fund. 0% (Trading 212) to 0.45% (HL fund ISA fee).
O (OCF or TER): what the fund manager charges. 0.03% (cheapest passives) to 0.85%+ (active funds).
T (Transaction): the bid-ask spread you pay each time you buy or sell. Tiny for liquid ETFs, larger for niche funds.
F (FX): when you buy a non-GBP-listed fund, you pay a spread on the currency conversion. 0.10% to 1.5% depending on platform.
X (Tax inefficiency): dividend withholding leakage when fund domicile and your residency are mismatched, plus differences between physical and synthetic replication tax treatment.
D (Drift): the gap between the fund's actual return and its index, after costs. Near zero for a well-run physical fund. Larger for some synthetic or actively-managed funds.
minus S (Securities lending): some funds (notably iShares and Vanguard) lend their holdings to short-sellers and rebate part of the income back to you. Typically 0.01% to 0.05%. Small offset.
The maths
Take a 35-year-old with £100,000 in an ISA, considering two options.
Option A: a typical retail self-directed portfolio. Held on Hargreaves Lansdown ISA (P = 0.045%, capped at £45/year for ETFs), in an active UK equity fund (O = 0.85%), with monthly contributions (T = 0.05%), GBP-bought (F = 0%), in a UK-domiciled fund with imperfect tax treaty coverage (X = 0.15%), with calendar rebalancing drift (D = 0.10%), no securities lending (S = 0%). Total: 1.20%.
Option B: an optimised passive portfolio. Held on Trading 212 ISA (P = 0%), in Vanguard FTSE All-World UCITS Acc, ticker VWRP (O = 0.22%), quarterly contributions (T = 0.02%), GBP-listed (F = 0%), Ireland-domiciled with strong tax treaty coverage (X = 0.05%), tight tracking (D = 0.02%), small securities-lending rebate (S = -0.01%). Total: 0.30%.
Same £100,000, same wrapper. Cost difference: 1.20% versus 0.30%, a gap of 0.90 percentage points per year. Over 20 years at 5% gross real return, that gap compounds to roughly £40,000 of terminal wealth lost on a £100k starting balance. The fund choice alone (the 0.85% active fund versus the 0.22% VWRP) accounts for less than half the gap. The other half comes from the components most factsheets do not show you.
Where it flips
Two situations where TER-only comparison is defensible. First, if you are comparing two ETFs on the same platform with the same listing currency and same domicile, the only varying components are O, T, and S, and TER captures most of O. Quick comparisons in this narrow case are fine. Second, in tax-advantaged accounts (ISA, SIPP, Roth, 401(k)) the X component is often near zero, which removes one variable. But P, T, F, and D still apply, so the headline TER is still misleading on its own.
What to do this week
List your three largest fund holdings.
For each, find the published TER, your platform's fee schedule, the listing currency (and your platform's FX spread if non-GBP), and the fund's domicile.
Sum the six components on paper. Compare against an equivalent low-cost passive holding (VWRP for global equity, VAGS for global bonds).
If the gap is more than 50 basis points, write down why you are paying it. Sometimes there is a good reason. If not, you have your switching candidate.
Figures correct as of May 2026; check live schedules before acting.
Principle 3 of 10
Check for overlap before you add a fund
The decision
Before you add a fund to your portfolio "for diversification," look at the underlying holdings of what you already own. If the new fund overlaps materially with what you have, you are not diversifying; you are concentrating. The look-through is a five-minute job on the fund's factsheet.
Why this matters
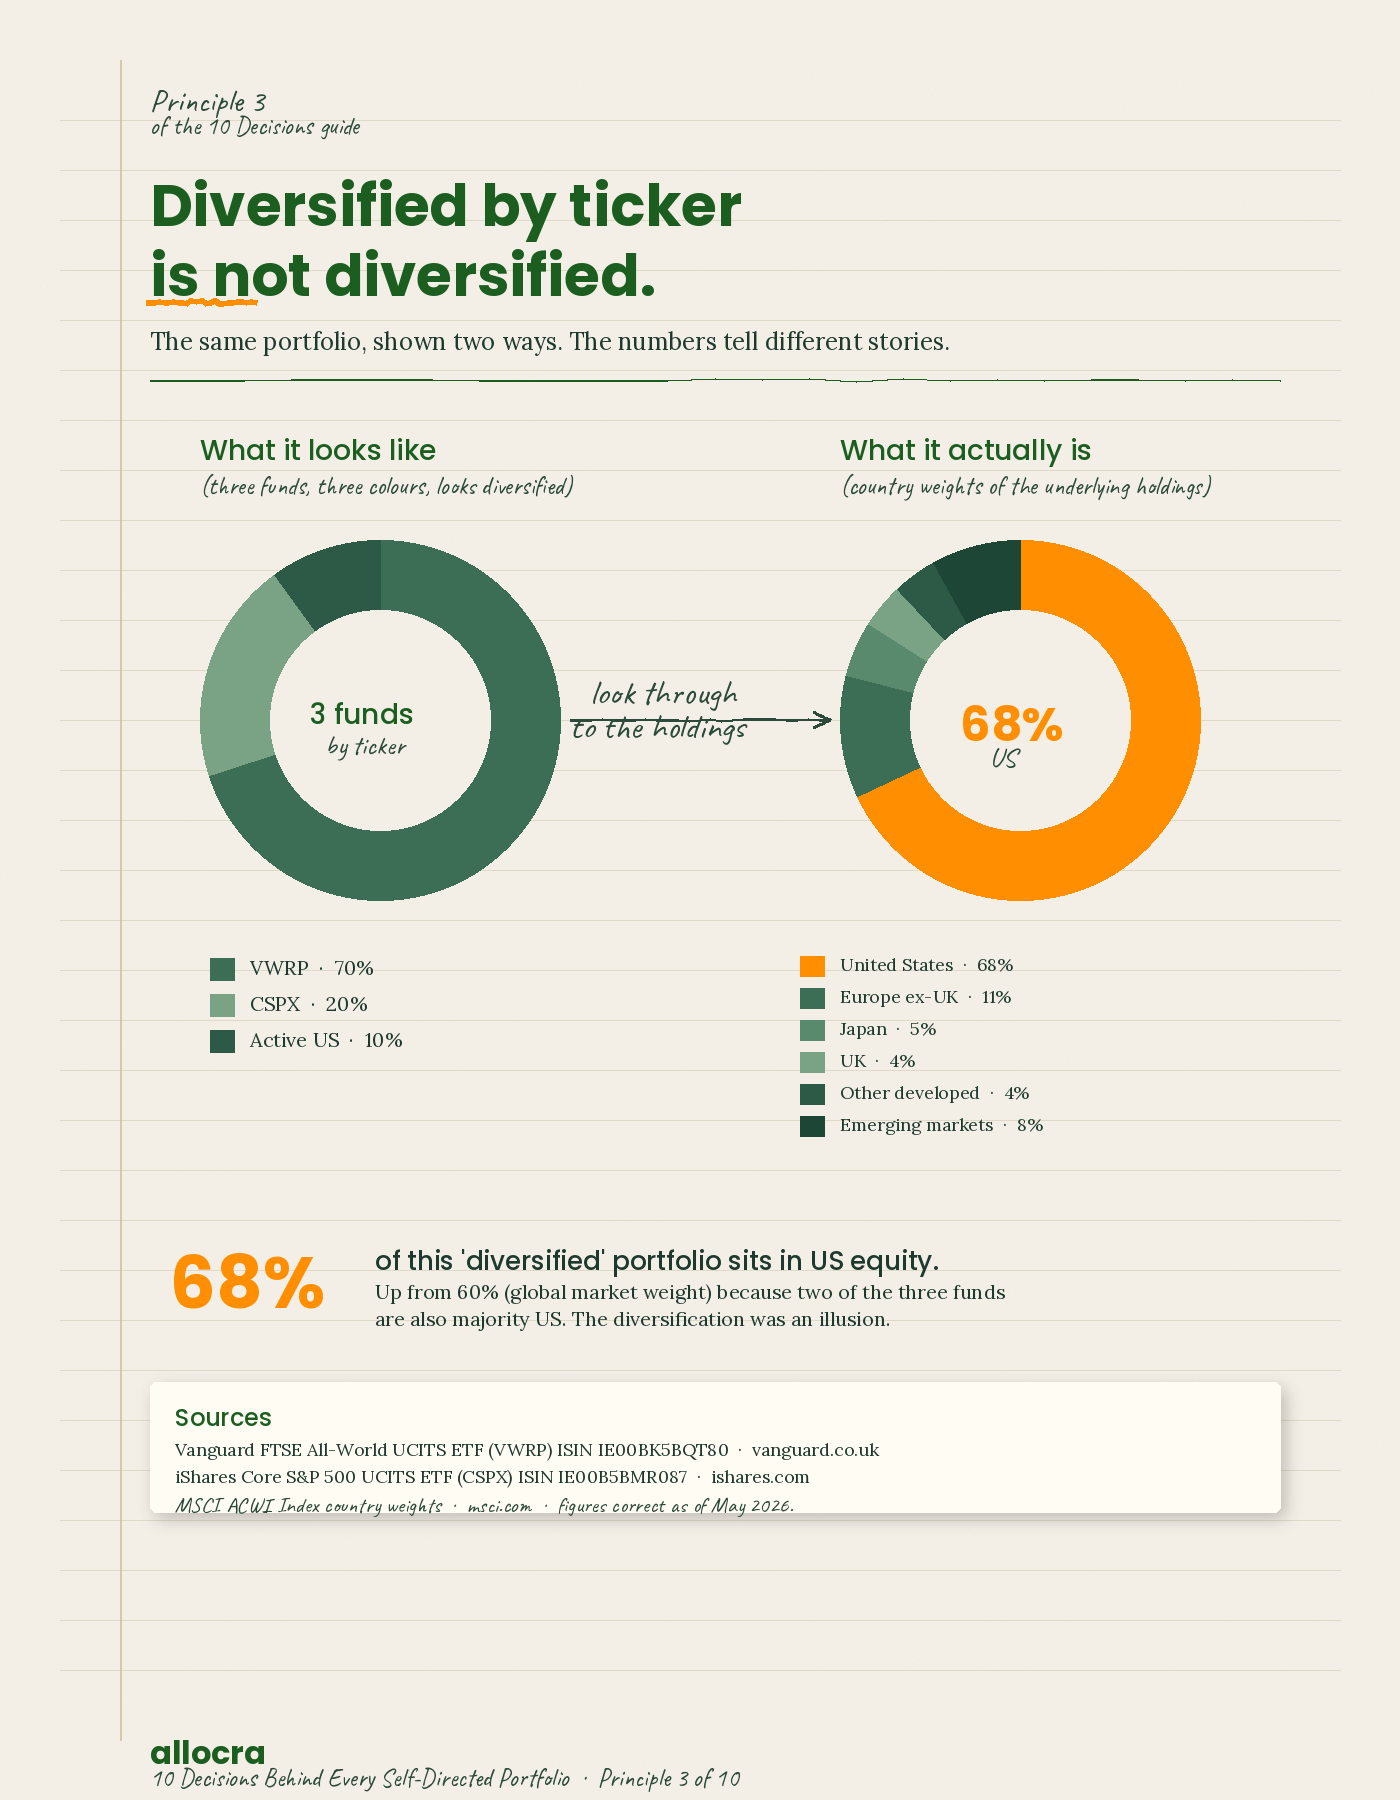
Most retail self-directed portfolios drift toward an unintended US large-cap concentration because investors pick funds by name without checking what they actually hold. The classic version: hold Vanguard FTSE All-World (VWRP) for "global exposure," then add iShares Core S&P 500 (CSPX) for "US exposure," then add an active US growth fund "for the tech tilt." All three funds are mostly the same 30 to 50 US companies. The portfolio looks diversified by ticker count. It is not diversified by underlying holding.
The maths
VWRP holds approximately 60% US equity as of May 2026 (the US share of global market cap). The top 10 holdings of VWRP are Apple, Microsoft, NVIDIA, Amazon, Alphabet (A and C combined), Meta, Tesla, Berkshire Hathaway, JPMorgan, and Eli Lilly. Those same 10 names make up roughly 30% of the S&P 500 (CSPX), and roughly 50%+ of most US-focused active funds.
Take a portfolio with 80% in VWRP and 20% in CSPX. The total US weighting is 80% × 60% + 20% × 100% = 68% US, up from 60%. You have added 8 percentage points of US concentration, not diversification. If you then add a 10% slug of an active US growth fund (reducing the others proportionally), the US weighting climbs further and your top-10 single-stock concentration rises with it. The portfolio is now significantly more exposed to a US drawdown than it appears to be.
The same trap exists in reverse. Holding both a "developed markets" fund and a "world" fund overlaps heavily. Holding a "European equity" fund and a "Eurozone equity" fund overlaps heavily. Holding a "tech sector" fund alongside any US index fund overlaps heavily. The diversification illusion comes from ticker count, not holdings.
Where it flips
Two cases where adding an overlapping fund is defensible. First, if you have a specific factor or sector tilt you genuinely want (e.g., "I want to overweight US tech beyond the market weight"), adding a sector fund on top of a global tracker is a deliberate concentration, not an accidental one. Fine, as long as you have written down why and accepted the increased single-factor risk. Second, if you are building a portfolio from components rather than buying an all-in-one fund: holding CSPX (US, 0.07% TER) plus VEVE (developed ex-US, 0.12%) plus EMIM (emerging markets, 0.18%) at market weights costs less in blended TER than holding VWRP alone (0.22%) for the same exposure. That is a cost optimisation strategy, not a diversification strategy, and it requires you to rebalance the components yourself.
What to do this week
List every fund you hold.
For each, look up the country weights (top 10 countries) and the top 10 holdings. Both appear on page 1 of any decent factsheet.
Sum the country weights across your whole portfolio, weighted by your allocation to each fund. Compare against a global market portfolio (approximately 60% US, 15% Europe ex-UK, 4% UK, 6% Japan, 5% other developed, 10% emerging, as of mid-2026 MSCI weights).
If your portfolio shows more than 70% US, more than 10% UK home bias, or a top-10 single-stock concentration above 25%, you have an overlap problem regardless of how many tickers you hold.
MSCI ACWI Index country weights: msci.com/index/factsheet/MSCI-ACWI.
Figures correct as of May 2026.
Principle 4 of 10
Match accumulating and distributing to your tax position, not your preference
The decision
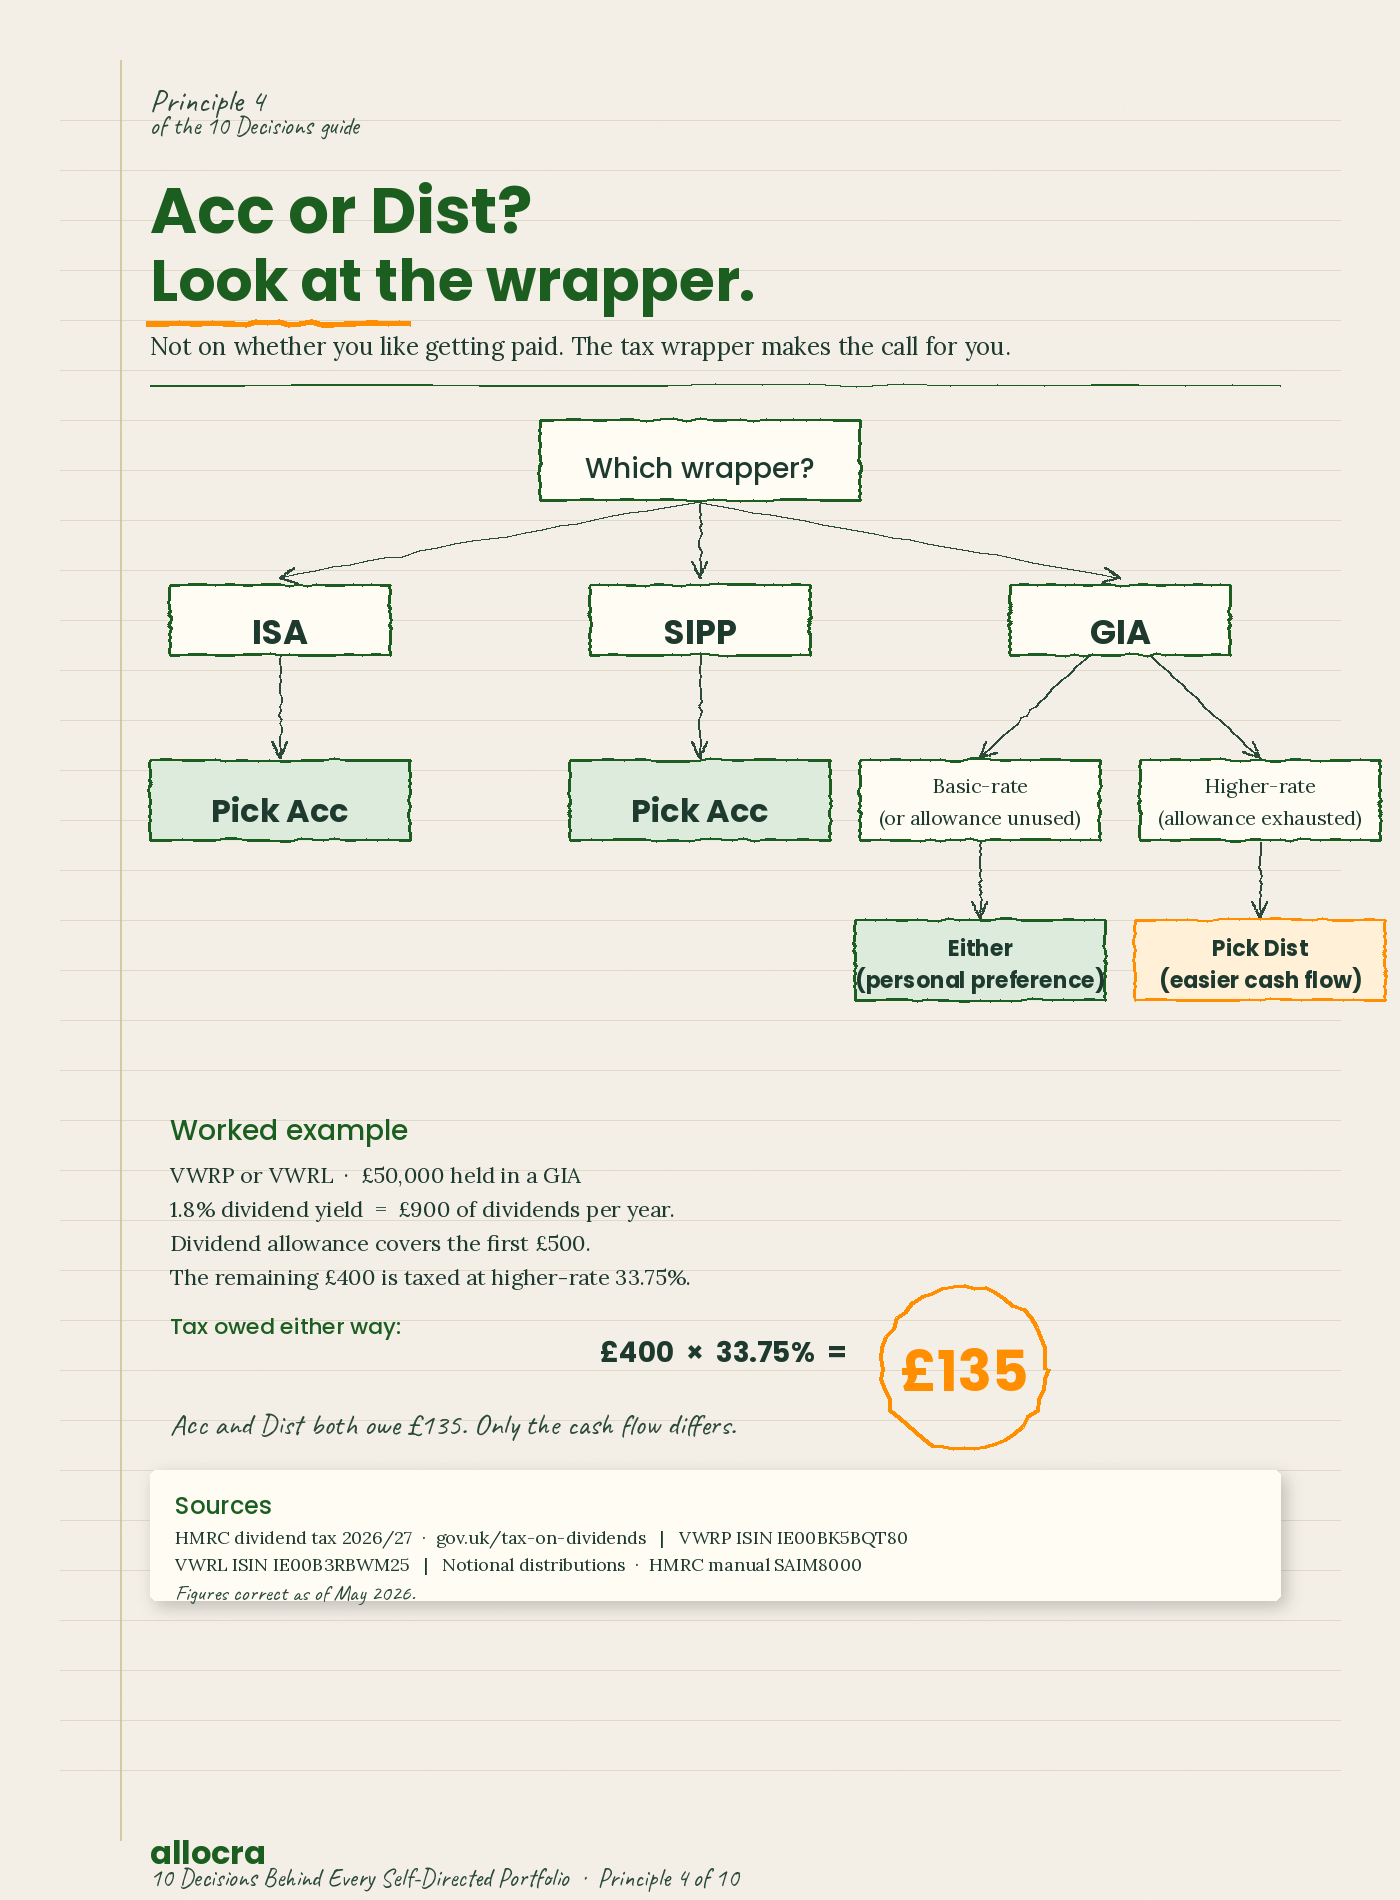
Acc (accumulating) and Dist (distributing) are two share classes of the same fund. Acc reinvests dividends inside the fund; Dist pays them to your cash account. Pick based on the tax wrapper the fund sits in and your dividend tax position, not on whether you "like getting paid."
Why this matters
Many self-directed investors default to distributing share classes because the income arrives visibly in their account. Inside an ISA or SIPP this is harmless but very slightly worse. In a general investment account (GIA), it can be materially worse depending on your dividend allowance and marginal rate.
The maths
Inside an ISA or SIPP. No UK tax on dividends or capital gains. Acc and Dist are economically equivalent in total return, but Acc is operationally cleaner: dividends compound automatically inside the fund at zero cost, with no cash drag between dividend payment and your manual reinvestment. The cost of cash drag on a 2% dividend yield reinvested quarterly is roughly 0.02% to 0.04% per year. Small, but free to capture by holding the Acc share class. Default to Acc.
Inside a GIA (taxable). UK dividend allowance for 2026/27 is £500. Dividends above that are taxed at 8.75% (basic rate), 33.75% (higher rate), or 39.35% (additional rate). Holding distributing means the dividends are crystallised and counted each year regardless of whether you reinvest. Holding Acc does not avoid this: HMRC treats Acc fund dividend reinvestment as a "notional distribution" taxable in the year it occurs (see SAIM8000 in the HMRC manual). There is no tax-deferral benefit to Acc in a GIA. You still owe the tax. The only difference is administrative: Dist gives you the cash to pay the bill; Acc requires you to find it elsewhere or sell a small portion of the holding.
Worked example. VWRP (Acc) and VWRL (Dist) are the same Vanguard FTSE All-World fund, same 0.22% TER. Both yield approximately 1.8% in dividends as of May 2026. On £50,000 held:
In an ISA: both produce identical after-tax return. VWRP saves perhaps 0.03% per year from cash-drag avoidance. Marginal preference for VWRP.
In a GIA for a higher-rate taxpayer: either share class generates £900 of taxable dividend. Tax owed: first £500 at 0% (allowance), remaining £400 at 33.75% = £135 of dividend tax. With VWRL, the £900 dividend lands in your cash account and is available to settle the bill. With VWRP, the £900 has been reinvested inside the fund, so the £135 must come from elsewhere or by selling a small portion of the holding. Both share classes owe the same tax; only the cash flow differs.
Where it flips
Two cases. First, if you are managing for income explicitly (you want dividends to fund living costs), Dist is the right choice everywhere, regardless of wrapper. Second, US investors face a different set of rules: 1940-Act US ETFs distribute dividends at the fund level by structural design, because US fund vehicles cannot accumulate within the fund the way UCITS funds can. The Acc-versus-Dist decision largely does not exist for US-domiciled funds.
What to do this week
List your current holdings and check whether each is Acc or Dist (the share class is named in the fund title; the ISIN identifies it).
For each, note the wrapper (ISA, SIPP, GIA, Roth, 401(k), taxable brokerage).
ISA and SIPP holdings: default to Acc; switch only if there is a specific reason not to.
GIA holdings: choose based on whether the dividend cash is easier to have available (Dist) or whether you want simpler operational reinvestment (Acc, knowing the tax bill still applies). For higher-rate taxpayers with material GIA balances, Dist is often the simpler answer.
Notional distribution treatment for Acc funds: gov.uk/hmrc-internal-manuals/savings-and-investment-manual/saim8000.
Figures correct as of May 2026.
Principle 5 of 10
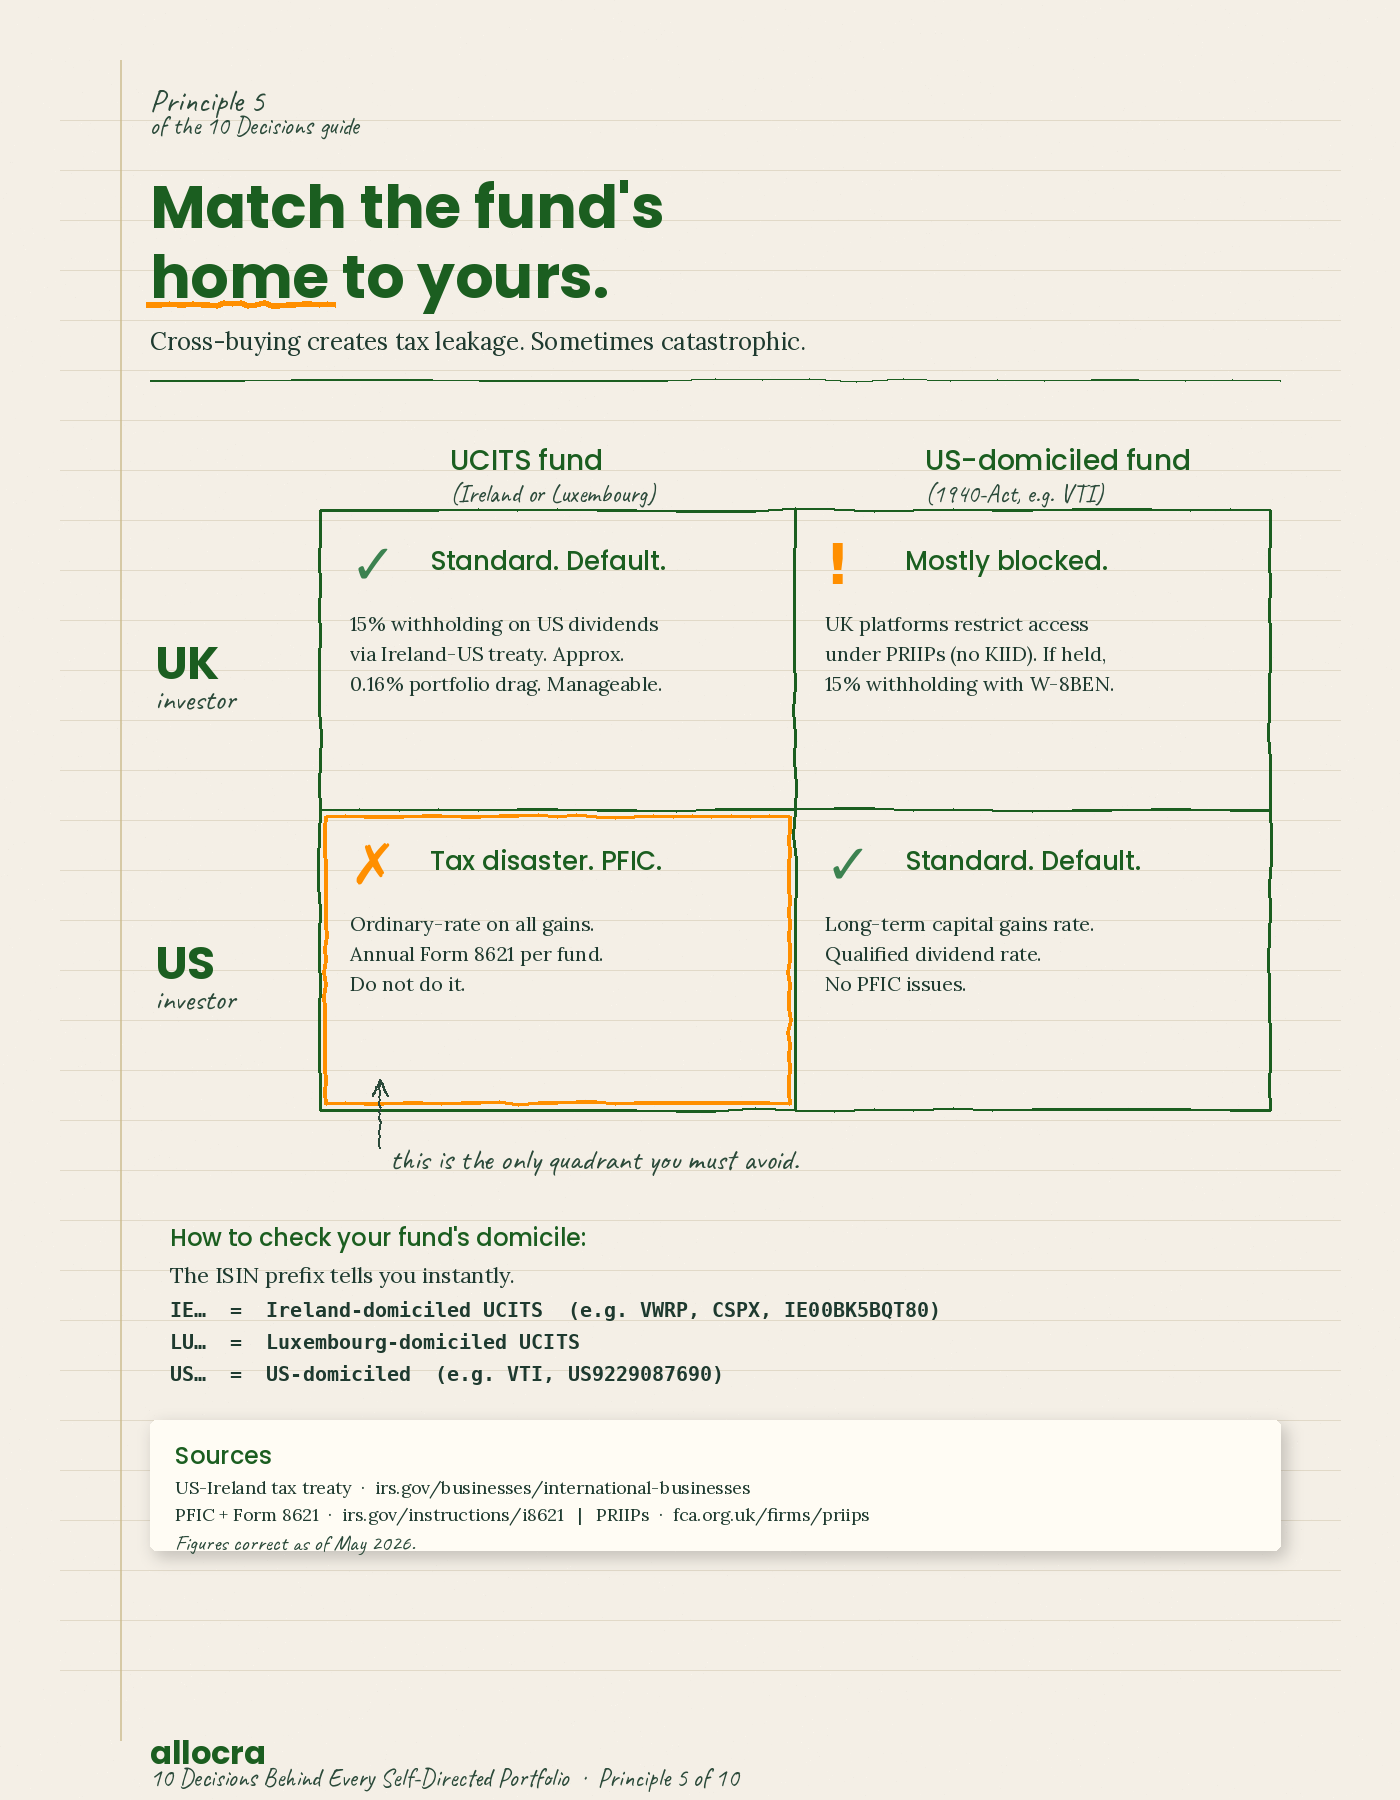
Pick a domicile-appropriate ETF
The decision
UK investors should default to UCITS funds, almost always domiciled in Ireland. US investors should default to US-domiciled 1940-Act funds, typically Delaware-registered. Cross-buying (UK investor holding US-domiciled, or US investor holding UCITS) creates tax problems that can dominate every other decision in this guide.
Why this matters
The domicile of an ETF determines two things: how dividends paid by the fund's underlying holdings are taxed at the fund level (dividend withholding tax under tax treaties) and how your country's tax authority treats your ownership of the fund. Get the match right and tax leakage stays minimal. Get it wrong and the leakage can exceed every other cost component you have spent time optimising.
The maths
UK investor holding an Ireland-domiciled UCITS ETF, e.g., VWRP. US companies inside the fund pay 15% dividend withholding under the US-Ireland tax treaty. The remaining 85% of the US dividend flows into the fund and compounds. As a UK investor you owe UK tax on the dividend only when it is distributed (or notionally distributed in the case of Acc funds) at your dividend rate. Total drag from US-source dividend withholding, applied to roughly 60% of the fund weight at 1.8% yield: approximately 0.16% per year. Manageable.
UK investor holding a US-domiciled ETF, e.g., Vanguard Total Stock Market (VTI), if the platform permits access. Two problems. First, US-listed ETFs do not produce UCITS Key Investor Information Documents (KIIDs) and most UK platforms restrict UK retail access under PRIIPs regulation. Second, even if you can hold one, the IRS withholds 15% on the distribution to a UK investor (with a W-8BEN form filed) or 30% (without). For US-equity-only exposure the net effect is broadly similar to UCITS; for global exposure routed through a US fund it is worse, because the US fund itself bears withholding on non-US dividends as a US holder. Not always catastrophic, but no advantage.
US investor holding an Ireland-domiciled UCITS ETF, e.g., VWRP. This is the catastrophic case. The IRS treats foreign-domiciled pooled funds as PFICs (Passive Foreign Investment Companies). PFIC rules apply punitive tax treatment: ordinary-income tax rates on all gains (no long-term capital gains rate), interest charges on tax that was deferred, and an annual reporting requirement (Form 8621) for each fund held. A US person holding a UCITS fund is in a tax disaster. Do not do it.
US investor holding a US-domiciled ETF, e.g., VTI. Standard US tax treatment: long-term capital gains rate on gains held over 12 months, qualified dividend rate on dividends, no PFIC issues. This is the correct path for US investors.
Where it flips
Two cases of nuance. First, dual citizens and US persons resident outside the US face a structural problem: UK and most non-US platforms generally cannot hold US-domiciled funds, and US PFIC rules forbid UCITS funds. The practical answer is usually individual stocks (no PFIC issue applies), a US-based brokerage account that accepts non-US residents (Schwab International, Interactive Brokers), or specialist tax advice. Second, UCITS funds domiciled in Luxembourg behave very similarly to Ireland-domiciled funds for UK investors. Luxembourg also has a 15% US dividend withholding rate under treaty, so functionally the choice between LU and IE comes down to fund-specific features, not domicile drag.
What to do this week
For each fund you hold, look up its domicile. The ISIN prefix tells you: IE (Ireland, UCITS), LU (Luxembourg, UCITS), US (US-domiciled).
If you are a UK investor, every fund should be IE or LU prefixed. If you have a US-prefix fund in your account, find out how it got there and look up the UCITS equivalent.
If you are a US investor, every fund should be US-prefixed. If you have a UCITS fund (IE or LU prefix), see a US tax advisor before doing anything else with it.
If you are dual UK/US or hold US person status while living outside the US, see a specialist tax advisor before making any new investment. The wrong move here can be expensive in five-figure or six-figure terms.
Sources
US-Ireland tax treaty dividend withholding rates: irs.gov/businesses/international-businesses/ireland-tax-treaty-documents. PFIC rules and Form 8621 instructions: irs.gov/instructions/i8621.
PRIIPs regulation and UCITS KIID requirements for UK retail access: fca.org.uk/firms/priips.
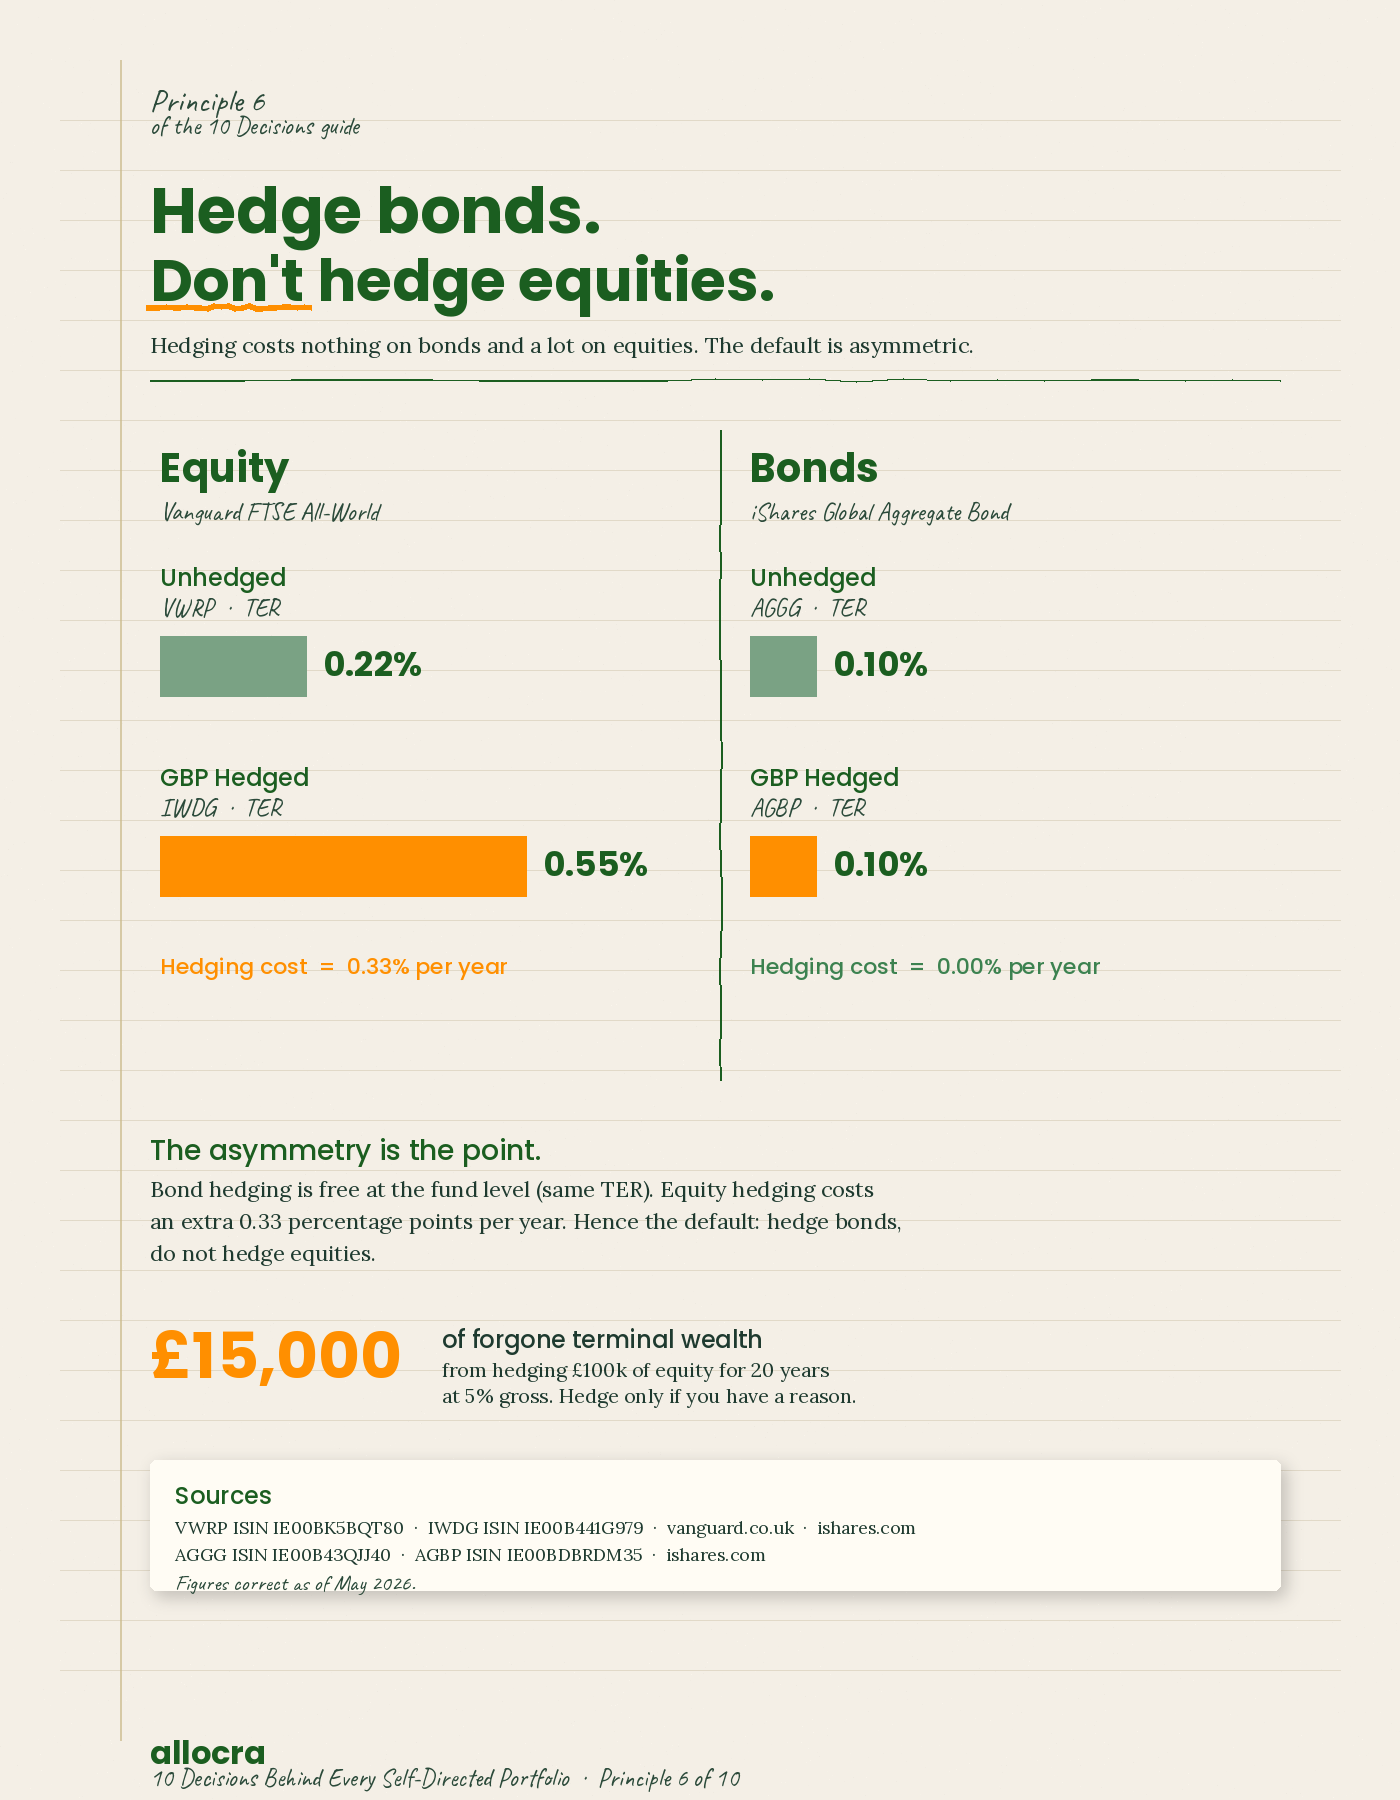
Pick a hedging policy for the whole portfolio. The common default for UK investors is hedge bonds, do not hedge equities. Once you have picked, apply it consistently across every fund you hold. The mistake is making the hedged-or-not call on a fund-by-fund basis, which usually results in an unintentional mix.
Why this matters
Currency exposure is a real source of risk in any portfolio holding non-domestic assets. A UK investor in Vanguard FTSE All-World (VWRP) carries exposure to roughly 95% non-GBP currencies. Sterling strength or weakness can dominate the return on any 12-month view, regardless of what the underlying equities did. Hedging removes that risk; the trade-off is that hedging costs money (0.10% to 0.30% per year in hedging fees and rollover spreads) and removes one source of diversification.
The maths
The cost of hedging is not uniform across asset classes.
Equities. For UK investors, hedged global equity is more expensive than unhedged. Compare Vanguard FTSE All-World (VWRP, unhedged, 0.22% TER) against iShares MSCI World GBP Hedged (IWDG, 0.55% TER). Roughly 0.33 percentage points per year of additional cost for the hedging service at the fund level. Over 20 years on a £100,000 equity allocation at 5% gross, the cost of hedging adds up to approximately £15,000 of forgone terminal wealth. Significant.
Bonds. The picture is different. Many UCITS bond funds offer GBP-hedged versions at the same TER as the unhedged. iShares Global Aggregate Bond UCITS (AGGG, 0.10% TER) and the GBP-hedged equivalent (AGBP, 0.10% TER) cost the same. Currency volatility can dominate bond returns over short windows, so hedging removes a layer of noise without adding cost. For most UK investors, GBP-hedged global bonds is the cleaner choice.
This is why the "hedge bonds, do not hedge equities" default works: it is honest about where the cost of hedging actually shows up.
Where it flips
Two cases. First, if your time horizon is long (20+ years) and you can tolerate currency volatility, the case for hedging equity weakens further; currency moves tend to mean-revert across long horizons, so the hedging cost compounds against you for no risk benefit. Second, if you are drawing down soon and short-term currency moves could affect the value at which you sell, hedging equity for the few years leading up to drawdown can be defended. US investors have a structurally different setup because the US dollar is the global reserve currency; the case for hedging international exposure back to USD is weaker, and most US-domiciled international funds are unhedged.
What to do this week
Write down your hedging policy in one sentence: "I hedge bonds. I do not hedge equities." (Or whatever you have chosen.)
Check every fund you hold. The share class name will say "Hedged" or "GBP Hedged" if it is. The default unhedged versions usually do not say anything.
Identify any mismatches. If you have hedged equity that you did not intend, or unhedged bonds that you did not intend, decide whether to switch.
Apply the policy to every new purchase going forward.
iShares Global Aggregate Bond UCITS ETF (AGGG) ISIN IE00B43QJJ40 and GBP Hedged (AGBP) ISIN IE00BDBRDM35: ishares.com.
Figures correct as of May 2026.
Principle 7 of 10
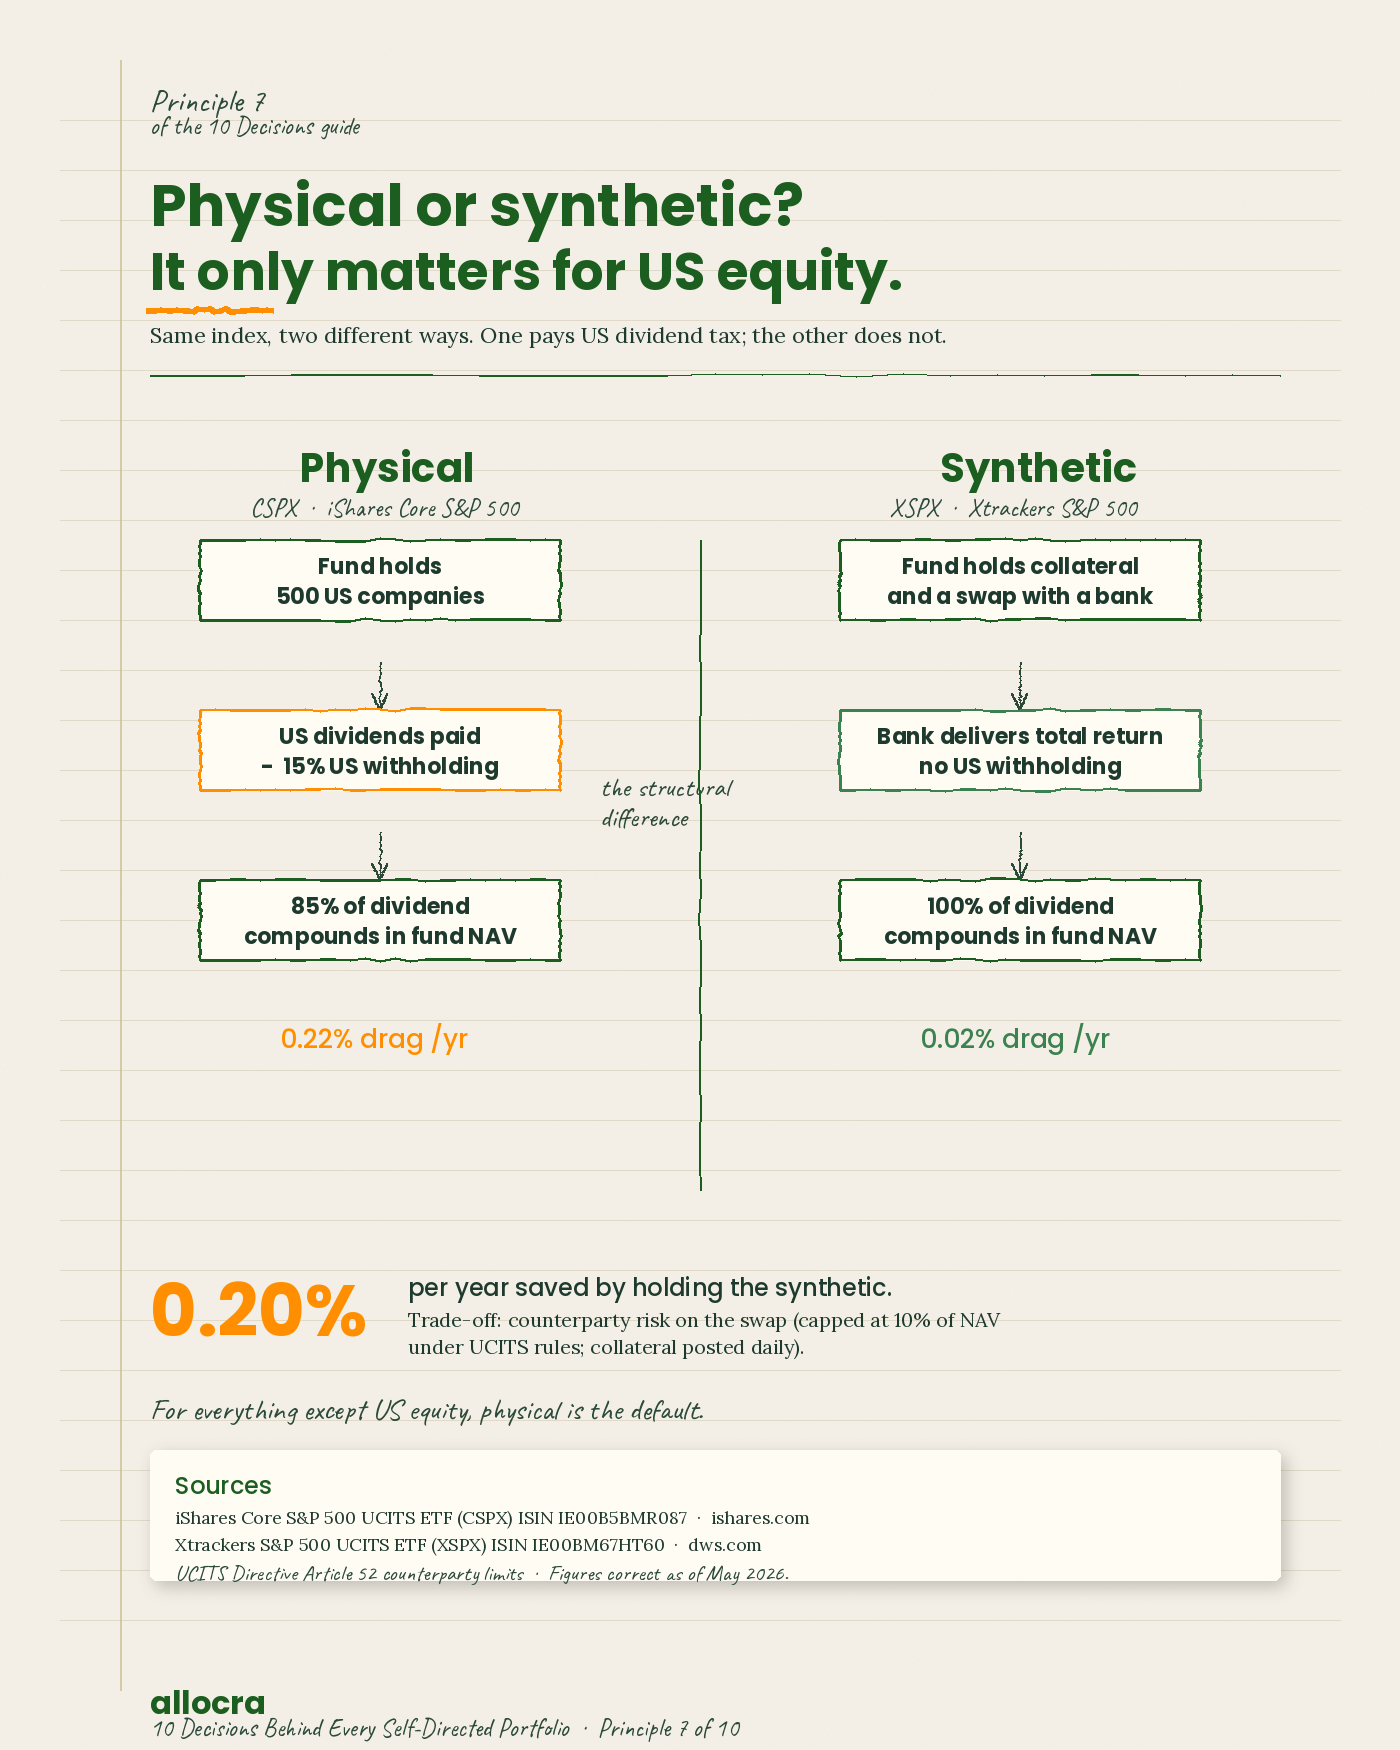
Physical replication is the default. Synthetic only with eyes open.
The decision
Hold physical ETFs (the fund actually owns the underlying assets) by default. Use synthetic ETFs (the fund uses swap contracts to deliver the index return) only where the structure delivers a clear advantage you have understood and accepted.
Why this matters
Physical and synthetic ETFs can track the same index but deliver subtly different outcomes. Physical is simpler: the fund holds the assets, you own a slice. Synthetic uses a derivative contract with a counterparty bank, which introduces a small counterparty risk and changes the tax treatment in some markets. For most exposures the choice does not matter. For one specific exposure (S&P 500 from a UCITS fund) synthetic can be materially cheaper because of how dividend withholding is handled.
The maths
S&P 500 exposure, the case where synthetic wins. Take iShares Core S&P 500 UCITS (CSPX, physical, TER 0.07%) against Xtrackers S&P 500 UCITS (XSPX, synthetic, TER 0.07%). The TERs are identical. The difference is in the dividend treatment. CSPX holds the actual S&P 500 stocks; the US withholds 15% on dividends paid to the Ireland-domiciled fund, which costs approximately 0.22% of the fund's NAV per year (15% × 1.5% dividend yield). XSPX uses a swap to deliver the total return of the S&P 500 including dividends, and under US tax law swaps on US equities are not subject to the same withholding. The synthetic fund avoids that 0.22% drag. Net outperformance of XSPX over CSPX: approximately 0.20% per year, attributable to the structure rather than the manager.
Counterparty risk. Synthetic UCITS funds are required to cap counterparty exposure at 10% of fund NAV (Article 52 of the UCITS Directive). The swap is typically with a major bank (Deutsche Bank, BNP Paribas, JP Morgan); collateral is posted daily. If the counterparty defaults, the fund liquidates the collateral. The risk is real but small.
Other exposures. For global ex-US, emerging markets, bonds, and sector funds, the synthetic advantage is minimal because the underlying withholding rates are lower. Physical is the default everywhere except S&P 500.
Where it flips
Two cases. First, if you are deeply uncomfortable with derivative structures or counterparty risk at any level, hold physical CSPX and accept the 0.20% cost. The figure is small in absolute terms and the simplicity has value. Second, for US investors holding US-domiciled funds (the standard case), this entire question is largely moot; almost all US-domiciled ETFs are physical, and the synthetic structure is rarer in US markets.
What to do this week
For each ETF you hold, check the factsheet for "replication method" (sometimes called "investment approach"). It will say "physical" or "full replication" or "sampling," or "synthetic" or "swap-based."
If you hold a physical S&P 500 UCITS fund (CSPX is the common one), consider whether the synthetic alternative (XSPX or Invesco S&P 500 UCITS, SPXS) is worth the structure trade-off to you.
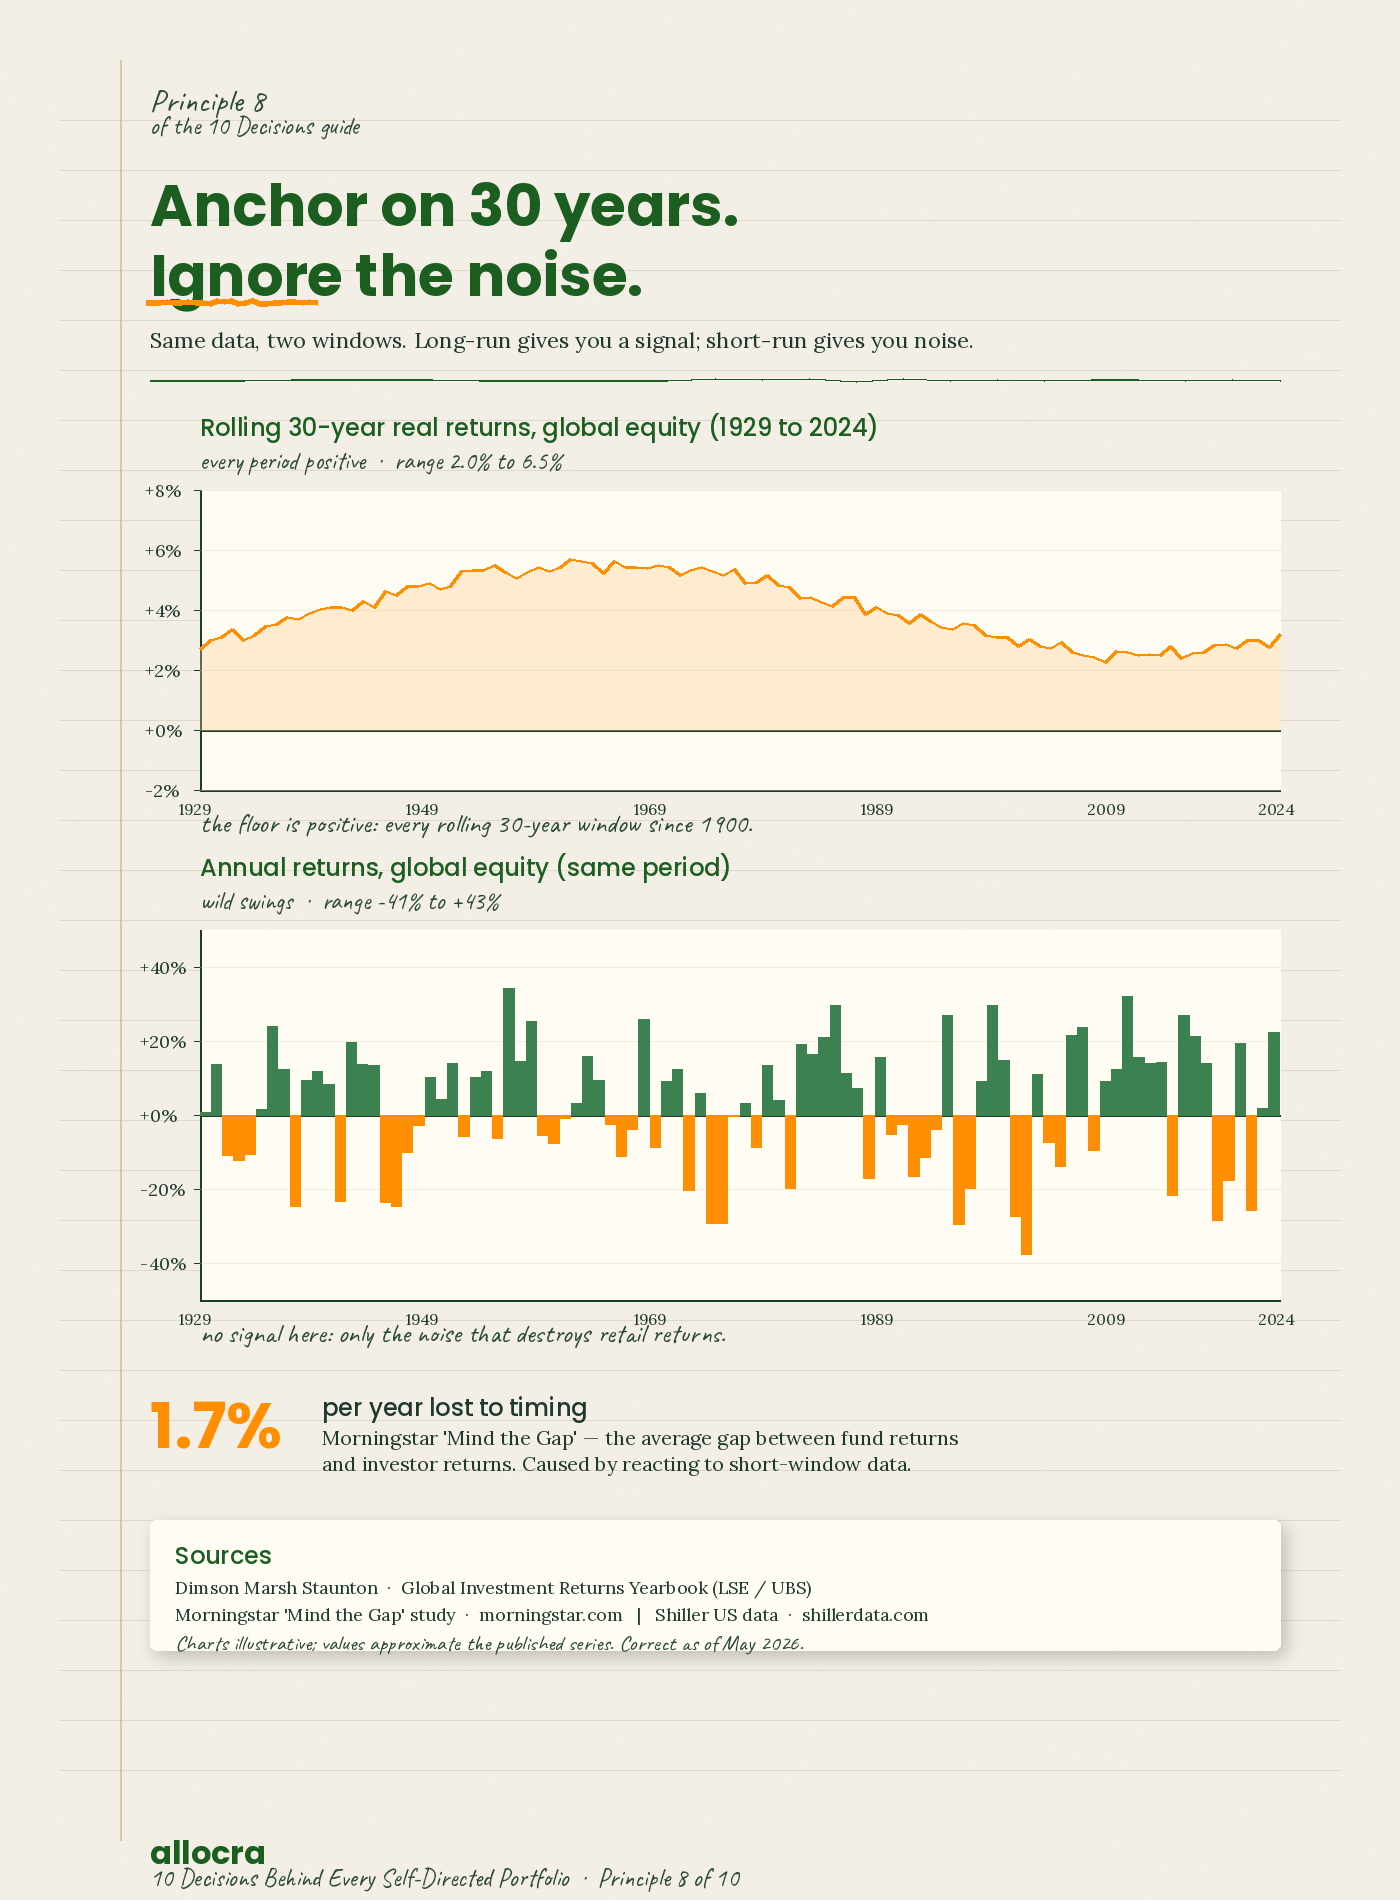
Anchor on long-run evidence, not the last quarter's headline
The decision
Size your portfolio against base rates that have held across multiple decades and economic regimes. Treat the last 12 months of returns as noise. The maths of mean reversion is unforgiving for investors who chase recent winners.
Why this matters
The single biggest source of underperformance in retail investing is timing. Investors buy after good performance, sell after bad, and end up earning meaningfully less than the funds they hold. The Morningstar "Mind the Gap" study estimates this gap at 1.7 percentage points per year on average. Funds compound at the headline return; investors compound at the headline return minus their timing mistakes. Anchoring on long-run evidence is the single behavioural defence against this.
The maths
The Dimson-Marsh-Staunton dataset (LSE Business School, updated annually) covers global equity returns from 1900 to 2024 across 21 markets.
Headline real returns, 1900 to 2024:
Global equities: approximately 5.0% per year real (after inflation).
60/40 global equity/bond portfolio: approximately 4.0% per year real.
Global bonds: approximately 1.5% per year real.
Cash (UK Treasury bills): approximately 0.7% per year real.
Rolling 30-year periods within that 125-year history: every 30-year period for global equities has delivered positive real returns. Every one. The worst was the 1929 to 1959 window (Great Depression plus WWII), which still returned approximately 2% per year real. The best was the 1979 to 2009 window at approximately 6.5% per year real. The variation is wide; the floor is not zero.
Compare against the shortest windows: 1-year returns for global equity have a standard deviation of around 16%. A bad year can be down 30% to 40%. A good year can be up 30% to 40%. There is no useful signal in any 1-year window.
For your portfolio decisions, the practical takeaway: size your equity allocation as if you will earn somewhere between 3% and 6% real per year on it over 20 to 30 years. Plan against the range, not the headline. Do not rebuild your portfolio because last year was good or bad.
Where it flips
Long-run base rates are the right input for sizing decisions (how much to hold, what risk level to take). Current data is the right input for tactical inputs: today's cash rate tells you what cash is yielding now, today's TIPS yield tells you what protected real bonds are pricing in, today's CAPE ratio tells you something about US equity valuations relative to history. Use long-run base rates for the structure; use current data for the inputs to that structure.
What to do this week
Look up the historical real return for each asset class in your portfolio (the Credit Suisse Global Investment Returns Yearbook is free and authoritative; the Dimson-Marsh-Staunton chapter has the figures).
Write down your expected return for each asset class over the next 20 years.
If your expectation is above the long-run base rate, write down why you think the future will be better than the past.
If your portfolio is constructed around return expectations based on data shorter than 10 years, find longer data and redo the construction.
Sources
Credit Suisse / UBS Global Investment Returns Yearbook (Dimson, Marsh, Staunton at LSE): publications.credit-suisse.com (and successor at ubs.com).
Robert Shiller US historical data: shillerdata.com. Aswath Damodaran NYU historical risk premia: pages.stern.nyu.edu/~adamodar.
Morningstar "Mind the Gap" study: morningstar.com.
Figures correct as of May 2026.
Principle 9 of 10
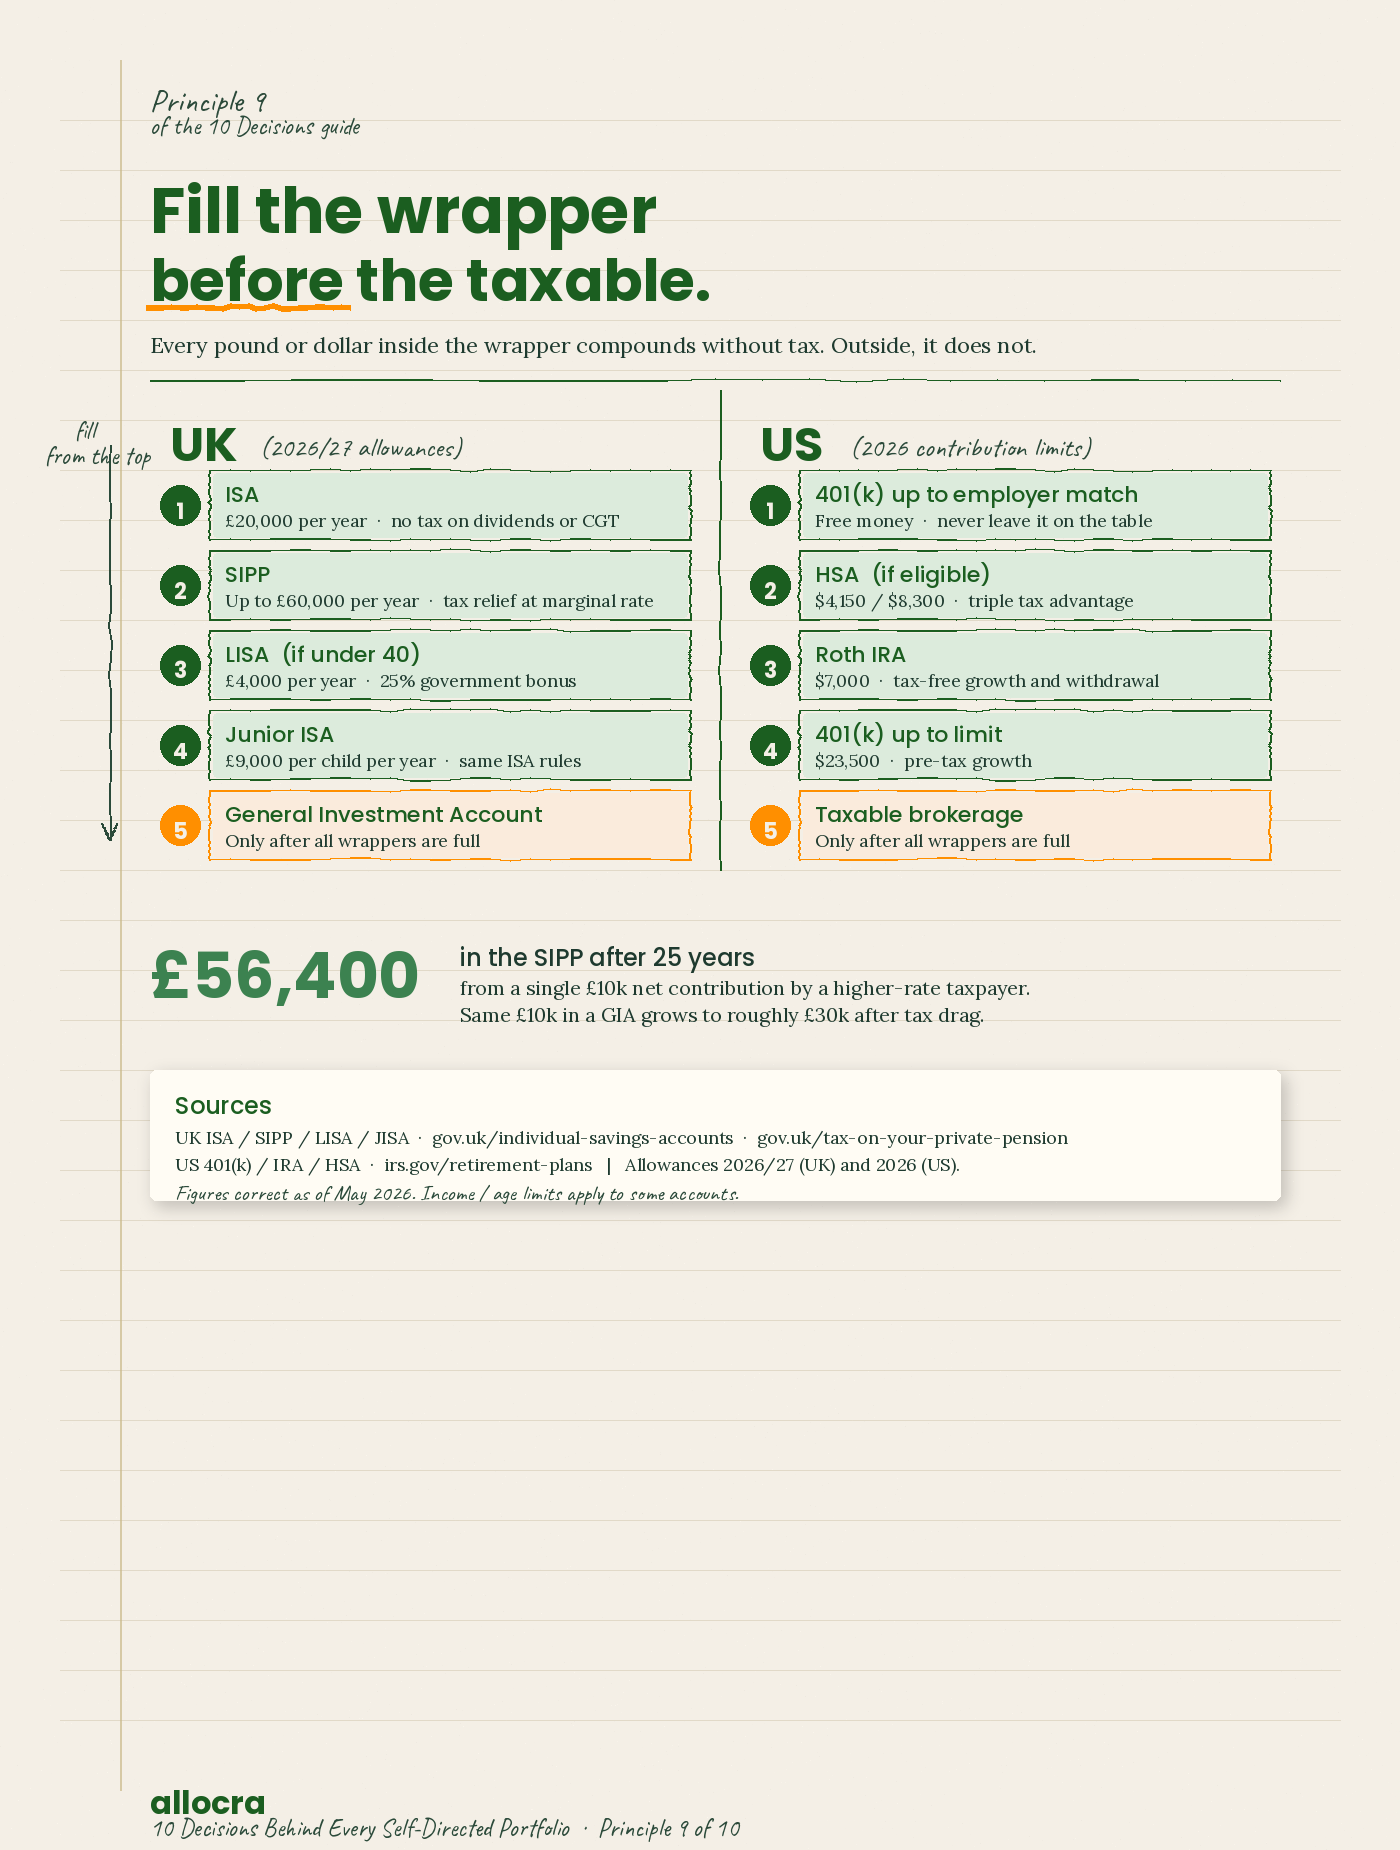
Fill tax-advantaged wrappers before taxable accounts
The decision
Always max out your tax-advantaged accounts before contributing to a taxable account. The maths of tax-free compounding is so much better than after-tax compounding that nothing else you do in the guide will move the needle as much as this one decision.
Why this matters
Money inside an ISA or SIPP (UK) or 401(k), Roth IRA, or HSA (US) grows free of income tax, dividend tax, and capital gains tax for as long as it stays inside the wrapper. Money in a general investment account or taxable brokerage pays tax on dividends each year and CGT when you sell at a gain. Over 30 years, that drag is the difference between two materially different ending balances.
The maths
UK allowances for 2026/27. ISA £20,000 per year. SIPP up to £60,000 per year (subject to annual allowance taper for higher earners). Junior ISA £9,000 per year. LISA £4,000 per year (counts within the £20,000 ISA limit).
UK worked example. A 45-year-old higher-rate taxpayer earning £80,000, with £30,000 to invest this year.
Path A: £20,000 into the ISA, £10,000 into a GIA. The GIA portion sees ongoing dividend tax (£500 allowance, then 33.75% on the excess) and CGT (£3,000 allowance, then 24% on the excess). Realistic drag on the GIA portion is around 0.4% to 0.7% per year depending on yield and turnover.
Path B: £20,000 into the ISA, £10,000 into the SIPP. The SIPP contribution attracts immediate higher-rate relief: £10,000 net becomes £16,667 gross. No dividend tax. No CGT. Funds compound undisturbed until drawdown.
Over 25 years at 5% real return, Path A's £10,000 GIA portion grows to roughly £30,000 net of tax drag. Path B's £16,667 SIPP grows to roughly £56,400 (with 25% tax-free at drawdown and the rest taxed at marginal rate). Even at the worst marginal rate at drawdown, Path B comes out materially ahead.
US allowances for 2026. 401(k) elective deferral $23,500 ($31,000 with catch-up at 50+). Roth IRA $7,000 ($8,000 at 50+, subject to income limits). HSA $4,150 individual / $8,300 family. SEP-IRA / Solo 401(k) for self-employed: significantly higher.
US priority order. The conventional order, in priority:
401(k) up to the employer match (this is free money; never leave it on the table).
HSA if you are eligible (triple tax advantage: deductible contribution, tax-free growth, tax-free qualified withdrawal).
Roth IRA up to the limit (or backdoor Roth if income disqualifies you).
401(k) up to the elective deferral limit.
Taxable brokerage.
Where it flips
If you need the money before you can access the wrapper (age 57 for SIPPs, 59.5 for IRAs and 401(k)s under current rules), the wrapper is not the right place. For genuinely short-term goals (house deposit, near-term major purchase), a GIA or taxable brokerage is the correct choice. The principle is about long-term retirement and wealth-building money, not all money.
What to do this week
Add up what you have already contributed to tax-advantaged accounts this tax year (UK 6 April to 5 April; US 1 January to 31 December for most).
Subtract from the annual limits. The gap is your unused tax-free space.
If you have any GIA or taxable brokerage contributions planned for the rest of the year, redirect them into the wrapper instead until the limits are exhausted.
Set up automated monthly contributions sized to consume the full annual limit. ISA £1,666 per month, SIPP up to £5,000 per month at the limit (less if your income or annual allowance constrains you).
Sources
UK allowances: gov.uk/individual-savings-accounts and gov.uk/tax-on-your-private-pension.
US allowances: irs.gov/retirement-plans. SIPP tax relief: gov.uk/tax-on-your-private-pension/pension-tax-relief.
Figures correct as of May 2026; check live limits before acting.
Principle 10 of 10
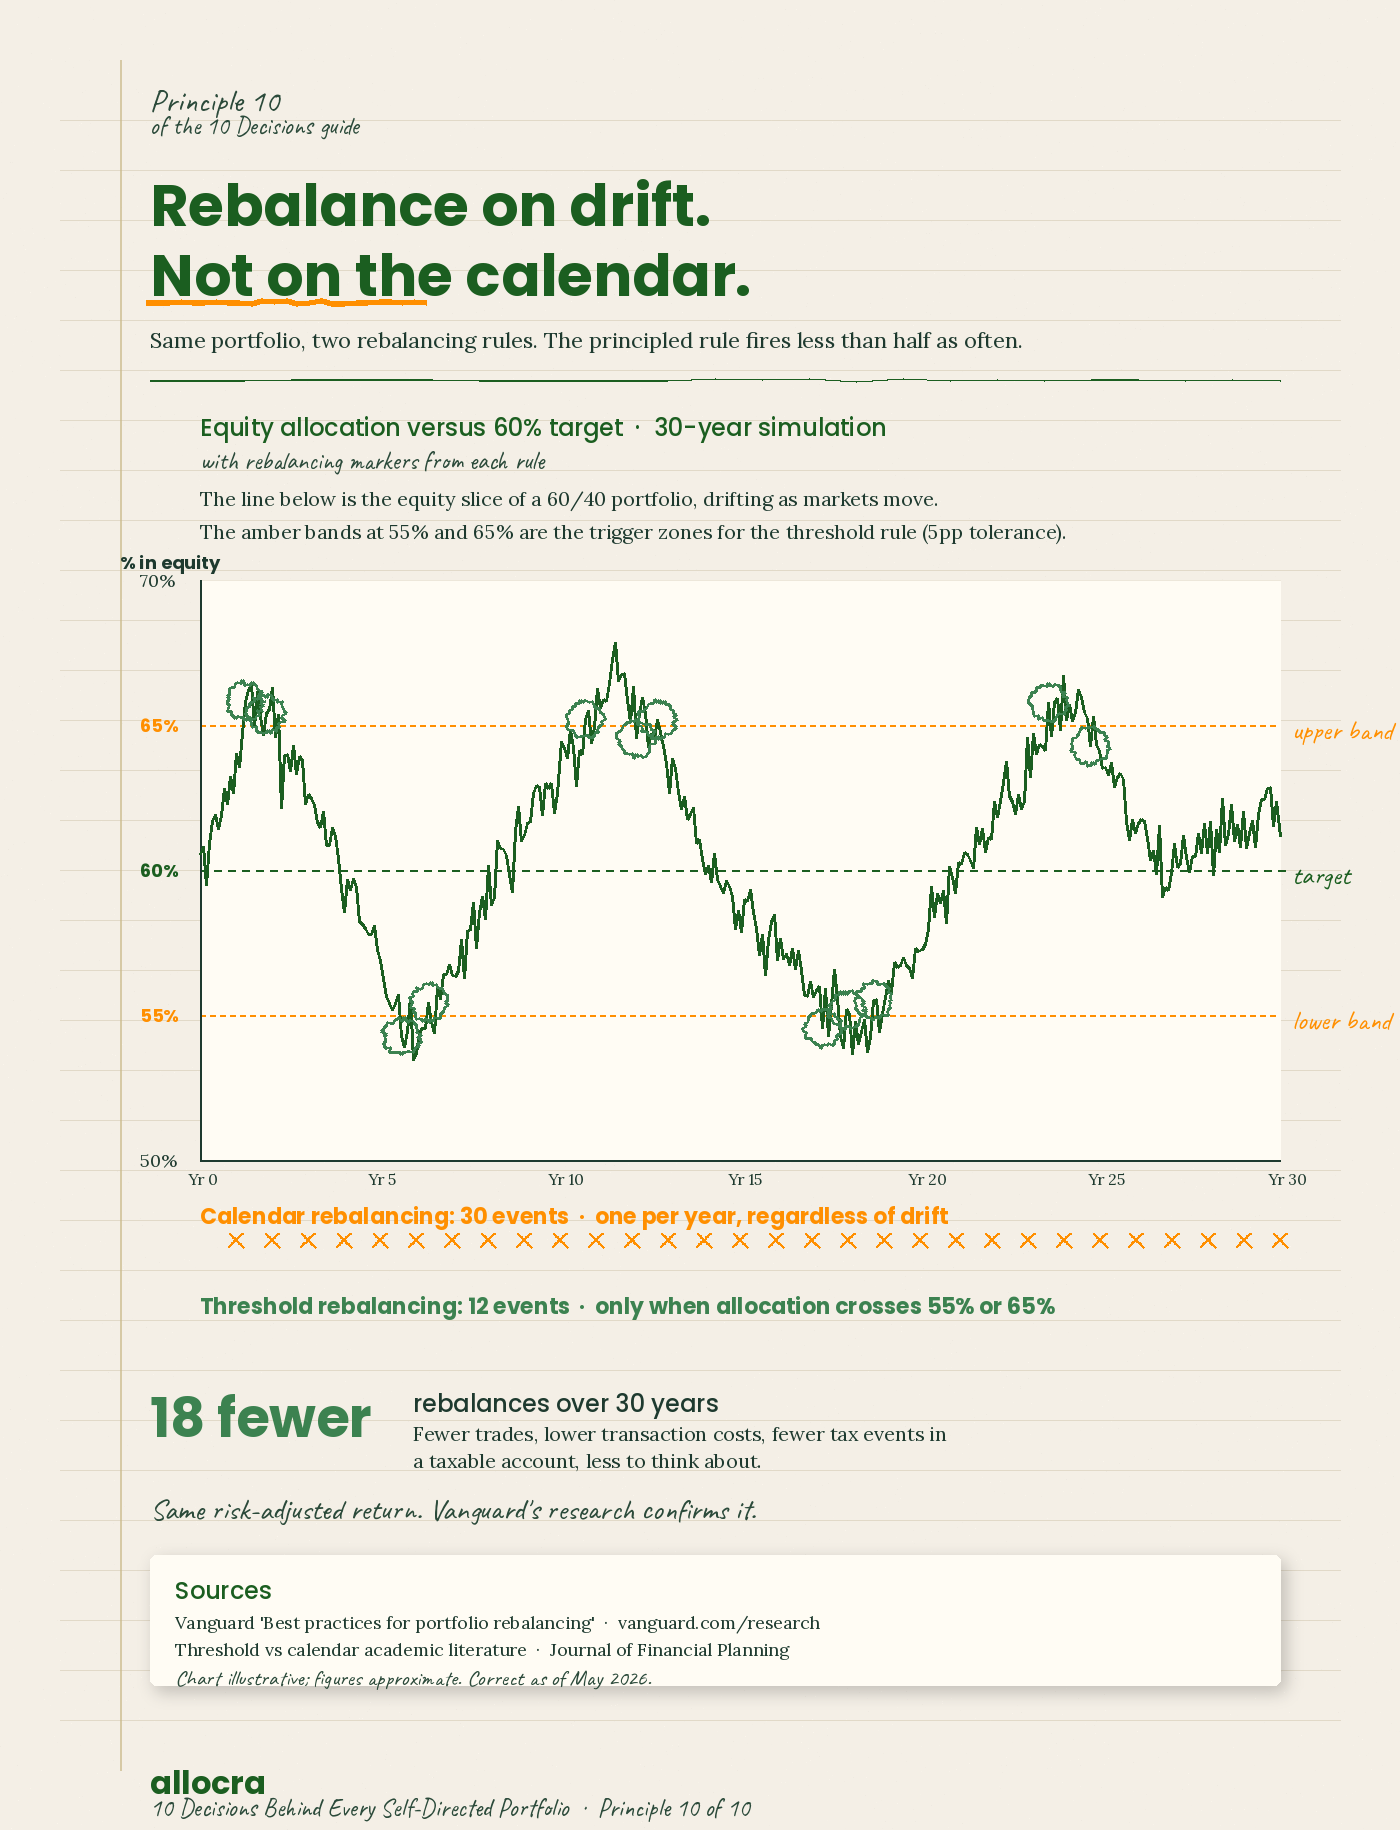
Rebalance on thresholds, not timetables
The decision
Rebalance when an allocation drifts more than a defined band from target. Not on a fixed calendar. Threshold rebalancing triggers fewer trades, generates less tax friction, and manages risk just as well as calendar rebalancing.
Why this matters
"Rebalance once a year" is a common piece of advice. It is also arbitrary. Calendar rebalancing fires whether the portfolio has actually drifted or not, generating unnecessary trades. Threshold rebalancing only fires when there is genuine misalignment worth correcting. Same risk management; fewer trades; lower frictional cost; less mental load.
The maths
Take a 60/40 target portfolio with a 5 percentage point band (rebalance when the equity allocation drifts to 65% or 55%).
Vanguard's "Best practices for portfolio rebalancing" paper (2010 and refreshed several times since) tested calendar rebalancing (annual, semi-annual, quarterly) against threshold rebalancing across decades of historical data. The findings are consistent. Threshold rebalancing with a 5% band generates approximately 0.05 fewer rebalances per year on average than annual calendar rebalancing, with no detectable difference in long-run risk-adjusted return.
Worked example. £200,000 portfolio, 60/40 target, 5 percentage point bands.
Calendar rebalancing (annual): 30 rebalances over 30 years. Each rebalance involves 1 to 2 trades. With a £8 commission and 0.05% implicit spread cost on the rebalanced portion (~£20,000), each rebalance costs approximately £18. Total over 30 years: £540.
Threshold rebalancing (5pp bands): typically 10 to 15 rebalances over 30 years. Same cost per rebalance. Total over 30 years: £180 to £270.
The £270 to £360 saving over 30 years is small in absolute terms on a portfolio of this size. The bigger benefits are in a taxable account, where each rebalance triggers CGT events on the trades, and in the reduced mental load of not feeling the urge to rebalance on dates when nothing has actually drifted.
Where it flips
Two cases. First, inside an ISA or SIPP where there is no CGT and many platforms offer commission-free trading, calendar rebalancing is essentially free. The case for thresholds is weaker. Second, for very small portfolios (under £20,000) the absolute drift in pounds is tiny, and threshold rebalancing might mean you never rebalance. A wide threshold or calendar rebalancing both work fine at small scale.
What to do this week
Write down your target allocation for each asset class.
Set rebalancing thresholds. 5 percentage points is the standard default. Narrower (3pp) if you want tighter control; wider (7pp or 10pp) if you want fewer trades.
Check your current portfolio against the thresholds. Rebalance only if you have crossed.
Set a quarterly calendar reminder to check, not to rebalance. Checking is free; trading is not.
Sources
Vanguard "Best practices for portfolio rebalancing" research paper: vanguard.com/research.
Academic literature on threshold versus calendar rebalancing: Journal of Financial Planning, Israelsen and others.
Figures correct as of May 2026.
How these decisions compound
Run all ten decisions on a portfolio and the cost drag drops from a typical retail-self-directed figure of around 1.55% per year to something closer to 0.30%. On a £500,000 portfolio held for 10 years at 5% gross, that cost gap compounds into roughly £93,000 of terminal wealth. On a £100,000 portfolio held for 20 years, roughly £40,000. The Allocra Cost Methodology v1.1 sets out the full derivation if you want to see how the figures are built.
None of this requires market timing. None of it requires you to read a 400-page textbook. It requires you to make ten decisions in the right order, and then to leave the portfolio alone while it compounds.
If you work through these ten decisions carefully, you will be applying the same principles a fee-only adviser would apply, with the same maths and the same evidence base behind them. The thinking is the same; the difference is who does it. That said, this guide is not a substitute for personalised advice. If your situation is complex or your portfolio is large, an adviser remains a sensible step.
Important Disclosure
This guide is general educational content for UK and US self-directed investors. It is not investment, tax, financial, or any other form of regulated advice. Nothing in this guide constitutes a personal recommendation. The decisions described here are described in general terms and may not be appropriate for your specific circumstances.
Allocra Ltd is not authorised or regulated by the Financial Conduct Authority in the UK, nor by any equivalent authority in the US. The information in this guide is based on tax rules, fee schedules, and market data current as of May 2026. Tax treatment depends on individual circumstances and may change. Fund tickers, platform fees, and tax thresholds may move after publication; check the live source before acting.
Investments can fall in value as well as rise; you may get back less than you invested. Past performance is not a guide to future returns. If your situation is complex (large portfolio, recent inheritance, expat tax status, business structure), if your portfolio is large enough that a mistake would be material, or if you are unsure whether a particular approach is right for you, consult a qualified independent financial adviser. Fee-only advisers charged hourly are listed at unbiased.co.uk and VouchedFor (UK) and through NAPFA (US).
Beta opens 20 July 2026.
The Allocra toolset (Screener, Optimiser, Tax, Dividends, Rebalancer) runs the calculations above in your browser. Inputs stay on your device. No affiliate links, no recommendations, no sales pitch.