Nobody Drew the Map
A single cell that redrew Tokyo’s railways overnight, the number 4.88, and last week’s answer.

This week
HMRC’s October list is out. The reporting funds list, the one that decides whether a gain on a fund held outside an ISA or pension is taxed as a capital gain or as income, was updated on Monday 12 October, with the data as at 6 October.1
Being on it is worth real money: a £10,000 profit on a fund that is on the list is a capital gain, taxed at 18% or 24% with the first £3,000 of gains in the year exempt; the same profit on a fund that is not is taxed as income at 20%, 40% or 45%, with no exemption and no offset against losses.10
343 share classes have been added since the 4 September edition, and 7 have come off; none of the 122 funds Allocra follows is among the seven. What it means for you: a fund launched over the summer can now be checked against the current edition rather than September’s, and a fund that was on last month’s list is on this one too; funds rarely come off the list.
Fifteen days to the Budget. Wednesday 28 October, lunchtime.2 Two things have been in the papers this week, a rise in capital gains tax and a cut to the pension tax-free lump sum. Neither is policy. The diary below holds what is law or stated policy today, and nothing has moved since last week. What it means for you: a decision taken on a rumour has worse odds than one taken on fact.

One number
4.88. If you held iShares Core S&P 500 (CSPX) outside an ISA or pension on 31 July 2025, you have income to declare that was never paid to you: £4.88 for every unit you held that day.34 Accumulating funds spare you reinvesting dividends by hand, and the dealing charges that come with it. Outside an ISA or pension the convenience has a price: the dividends you never saw still count as your income, and the figure has to be found, worked out and declared.
The fund kept its dividends rather than paying them out, and the rules treat the kept income as yours, received on 31 January 2026 and taxed as a dividend in 2025/26.5 What to do: find the units you held on 31 July 2025 on your platform statement, multiply by £4.88, put the result on the return due by 31 January 2027 as a foreign dividend, and add the same amount to what you paid for the units so it is not taxed again when you sell. 100 units is £488. Inside an ISA or pension there is nothing to do.
The question
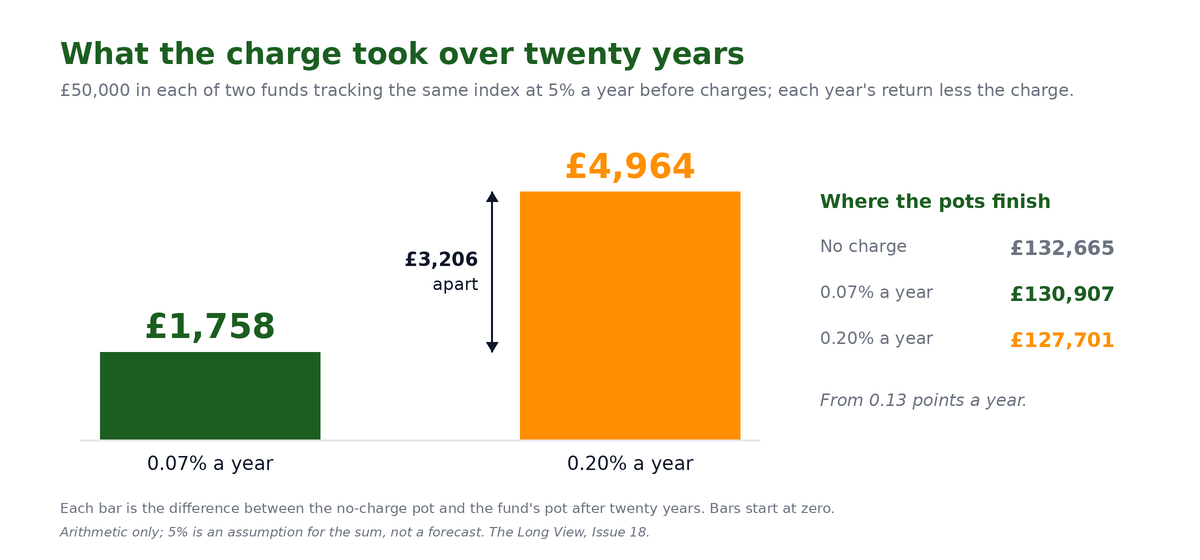
Last week’s answer. Two funds tracking the same index at 5% a year before charges, £50,000 in each for twenty years: the fund charging 0.07% finishes at £130,907 and the fund charging 0.20% at £127,701.6 £3,206 apart, from a difference of 0.13 points a year. With no charge at all the pot would be £132,665, so the cheaper fund gives up £1,758 over twenty years and the dearer one £4,964. Extrapolate that delta out over a complete portfolio; whilst the gap isn’t large in any one year, it proves material in the end.
This week’s question. Issue 17 gave the share of iShares Core S&P 500 (CSPX) held in its ten largest companies as 38.7%, by the issuer’s holdings file dated 24 September.7 The fund’s own file is published daily. Two weeks on, is that share higher or lower, and by how much? Reply with your guess; the figure, from the file dated the day before the issue, is in next week’s edition.
The long read: Nobody drew the map
In a laboratory in Sapporo, a team led by Atsushi Tero took a large plastic dish, wet its surface, and laid out thirty-six flakes of oats.8 The flakes were not placed at random. Each one sat where a city sits in the Greater Tokyo area, in the right position and at the right distance from the others. A perfect map, at scale, created by oat flakes. In the middle, where Tokyo itself would be, they put a small yellow blob of Physarum polycephalum, a slime mould: a single cell, no brain, no nervous system, that feeds by sending out tubes and crawling slowly towards anything it can consume.
They left it overnight.
At first the mould did what moulds do. It spread across the whole dish in a fine, indiscriminate mesh, reaching every flake at once. Then it began to edit. Tubes that carried a lot of nutrient between flakes thickened. Tubes that carried little thinned, and then vanished. Twenty-six hours after it was placed in the dish, the mould had settled into a web of thick yellow lines joining the oats. The web looked like something the researchers already had pinned on the wall; the railway map of Tokyo.
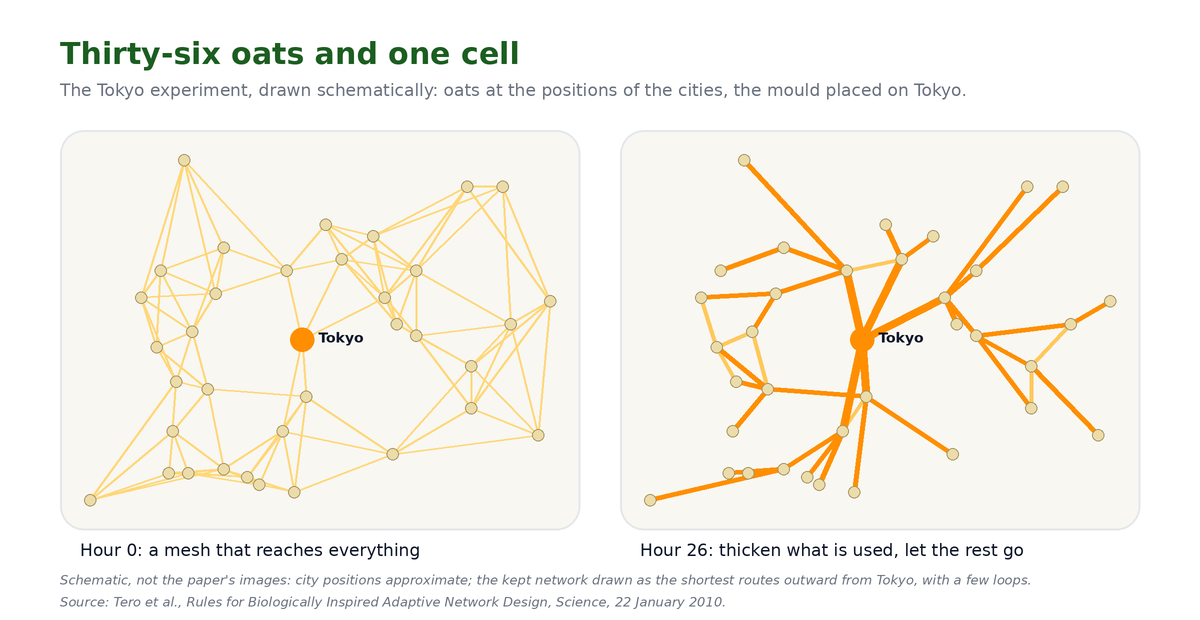
This wasn’t an illusion or chance event. When the team measured the two networks, their own and the one Japan’s railway engineers built over the course of a century, they came out comparable on the three things a transport network is judged by: the total length of track, how directly any two points connect, and how well the system copes when one link is cut. The paper was published in Science, January 2010.8 The method, written down, is summarised in a sentence: thicken what is used, let the rest perish.
That is the whole story. Have a think about how that relates to today’s funds investor. The mould had no idea of Tokyo, let alone a map of its cities. It had no plan, no model of the terrain, and no idea there was a right answer. It had one rule and a lot of time, and the rule produced a map a planning department would have approved.
Now look at a fund that holds a whole market, weighted by the size of each company. Nobody at the fund chooses the companies. Nobody decides that one should be larger than another. Every day, millions of people buying and selling for their own reasons move prices, and the fund’s holdings follow the prices. A company that attracts money gets a thicker tube. A company that loses it gets a thinner one, and eventually withers away. The map redraws itself, overnight, without a planner. It is the mould’s rule running on money instead of oats.
Now here is the part of the story to focus on. The same rule that builds an efficient network also builds a concentrated one. Thicken what is used, let the rest go, is exactly how Issue 17’s ship came to be top-heavy: the seven companies at the head of both the world fund and the American one are the thick tubes, and they are thick because the rule made them so, not because anyone thought seven was the right number. If you hold such a fund, you hold the shape the market is in right now. You did not choose it, neither did anyone else.
What happens when someone does try to draw the map by hand? S&P Dow Jones Indices counts, every year, how many funds with a manager choosing the companies, have beaten the plain market index they measure themselves against. In the ten years to 31 December 2025, 93% of UK equity funds run that way finished behind their benchmark, and in 2025 alone the figure was 88%, a year the firm’s own commentary describes as one in which a few stocks carried the index and missing them was costly.9 That is not a verdict on any manager. It is a description of how hard it is to out-draw a map that redraws itself every night for free.

Diary
- 28 October 2026 The Budget.
- 6 April 2027
- Unused pensions come inside inheritance tax.
- Savings income tax rates rise by two points.
- The £12,000 cash ISA limit for under-65s.
- The 22% charge on cash interest in stocks and shares and Innovative Finance ISAs, and the money market fund rule, come into force (SI 2026/1018).
- 8 June 2027 New fund disclosure rules become mandatory.
- 6 April 2028 The earliest age to draw a pension rises to 57.
- 6 April 2029 Salary sacrifice above £2,000 starts to attract national insurance.
- 5 April 2031 The inheritance tax threshold freeze ends.
Reply with your answer, or with anything you spotted this week that should have been here.
Where the figures come from
- HM Revenue and Customs, Approved offshore reporting funds, list updated 12 October 2026 (file dated 6 October 2026); previous edition 9 September 2026 (file dated 4 September 2026). The counts are Allocra’s comparison of the two files: 343 ISINs added, 7 removed. gov.uk.
- HM Treasury, the Chancellor’s letter to the Treasury Select Committee, 31 July 2026, setting the Budget date of Wednesday 28 October 2026.
- iShares VII plc, reportable income for the period ended 31 July 2025 (published spreadsheet, read 10 October 2026): iShares Core S&P 500 UCITS ETF USD (Acc), ISIN IE00B5BMR087, excess reportable income USD 6.701337 per unit, fund distribution date 31 January 2026. The figure with its working, and a box for your own units, is at allocra.co/excess-reportable-income/cspx.
- Bank of England Database, daily spot exchange rate, US dollar into sterling, series XUDLUSS: 1.3720 published 30 January 2026, the last published rate before the distribution date, which fell on a Saturday. USD 6.701337 at 1.3720 is £4.8844.
- The Offshore Funds (Tax) Regulations 2009, regulations 94, 95, 96 and 99; HMRC helpsheet HS284 (2025) section 6; SA106 notes and SA100 (2026) page TR3.
- Last week’s question: £50,000 compounded for twenty years at 5% less the charge each year: 0.07% gives £130,907; 0.20% gives £127,701; no charge gives £132,665.
- iShares, holdings file for iShares Core S&P 500 UCITS ETF dated 24 September 2026: top ten holdings 38.7% of the fund (Issue 17).
- A. Tero, S. Takagi, T. Saigusa, K. Ito, D. P. Bebber, M. D. Fricker, K. Yumiki, R. Kobayashi and T. Nakagaki, Rules for Biologically Inspired Adaptive Network Design, Science, vol. 327, 22 January 2010, pp. 439 to 442: 36 food sources placed at the positions of cities in the Greater Tokyo area; the network formed over 26 hours; comparable to the Tokyo rail network on cost, efficiency and fault tolerance.
- S&P Dow Jones Indices, SPIVA Europe Scorecard Year-End 2025 (data to 31 December 2025), Report 1a: sterling-denominated UK Equity funds underperforming the S&P United Kingdom BMI, 88.19% over one year, 92.98% over ten years; and Indexology blog, One to Forget: SPIVA Europe U.K. Equity Active Fund Performance in 2025, 7 April 2026, on the skew of 2025 returns to a few stocks.
- Capital gains tax: gov.uk, Capital Gains Tax rates and allowances, rates of 18% and 24% and the £3,000 annual exempt amount for 2026/27. Offshore income gains: the Offshore Funds (Tax) Regulations 2009, regulation 17, charged to income tax at the holder’s marginal rate, 20%, 40% or 45%; the annual exempt amount and capital losses do not apply.
Diary: Finance Act 2026; SI 2026/1018; FCA PS25/20. Nothing here is a recommendation.
The Long View is written by Allocra. If you hold funds outside an ISA or pension, Allocra works out figures like the one above, the reporting status, the excess reportable income and the gains, for the funds you actually hold, from your own records. allocra.co